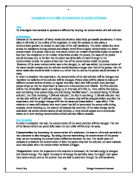
Water diffuses into
Vacuole
Water diffuses into
Surrounding
Solution
- Water particles
-
Salt particles
As a result of osmosis I predict that the bigger the salt concentration in each separate solution, the potato would have a large decrease in size. Which would mean that the smaller the salt concentration in each solution, the potato would have a large increase in size.
Method
(Refer to appendix 1)
To prepare a potato for the experiment, it must be peeled and then cut into several pieces using a cork borer. By using a cork borer we can insure that all the potato pieces/chips are the same width. This will be easier to make the experiment a fair test because, all we’ll need to do is cut the chips using a ruler so that they are all the same length. Then we must weigh each chip on an electronic weighing scale; this will insure more accuracy in our results. After that we shall record its weight (grams) and its length (centimetres) in a table.
After we prepare the potato, we should place five single chips in separate tubes containing different concentrations of water and salt. Each tube will have a solution with a difference of 5%: So for example the salt concentrations will be – 0%, 5%, 10%, 15%, and 20%. The percentage of salt can not be above 25% because the solution would have reached its saturation point. Also to make sure that the investigation is a fair test we will have to insure that each amount of the solution is the same volume.
We shall then leave the chips to soak for 24 hours. When the time is over we then take the chips out of the solutions and weigh and measure each one for the second time. We then record our findings and look to see if they have increased or decreased in size. After that, we then repeat the experiment and compare the results. The first experiment done will be called “Set A” and the second will be called “Set B”, to avoid any confusion.
Results from Set A
Results from Set B
Differences from Set A
Differences from Set B
Analysis and Conclusion
(Refer to appendix 2 and 3)
The graph that illustrates any length decrease or increase shows that in both experiments, the potato chip became shorter as the concentration of salt became stronger. Apart from chip 1 and 6 which were both soaked in a 0% salt concentration of water, these two chips increased in size. Also in both experiments the graph displays that for two chips there is no increase or decrease. This is reflected on the graph as a flat line.
The second graph I plotted illustrates any weight lost or gained by the potato chips. At first for Set A and Set B the chips soaked in a 0% concentration gained weight. But from there both lines have a steep negative gradient to show a drastic decrease in weight for the chips soaked in a 5% concentration. For the chips left in 10% and 15% concentrations the weight loss gradually decreases, this is reflected on the graph as a steady positive gradient line. The chips that were left in the 20% concentration for both Set A and B had the same decrease in weight as the chips soaked in the 15% salt concentration. As seen on the two graphs the length and weight results of the two experiments are very similar and show a close relationship.
Chips 1 and 6 were the only chips that increased in length and weight, both of these chips were soaked in a 0% concentration. So by this I can assume that the salt concentration inside the potato cell’s vacuole was stronger than the surrounding solution. When the concentration is at 5% the weight of the chips dramatically decrease, but the length has if any a slight increase. This indicates to me that the situations reversed and that the surrounding solution had a stronger concentration than the vacuole’s sap, causing it to shrink in size. Although from the 10% concentration onwards there is a loss in weight and length, it gradually decreases as you go alone to the 20% concentration. This is because the amount of salt in the surrounding solution is already quite high when you get to the 10, 15, and 20% concentrations. So as the concentrations become stronger the less amount of diffusion takes place because only a small amount of the vacuole’s sap is needed to saturate the outside solution. Therefore the potato chip does not lose as much weight as expected. In this experiment the length of the chips did not change four times, twice in Set A and twice in Set B, this happened even though the weight decreased. Here I am made to believe that the chips must have shortened in width and not length.
Evaluation
In my investigation I wasn’t happy with the length results which I obtained after doing the experiment. They did not really relate to the results I had recorded about weight. For example – chip2, its weight decreased and its length increased. This is probably because I measured the length of the potato chips using a ruler and unlike where I weighed the chips using an electronic weighing scale, there was an opportunity for human error to occur. If I decided to take the time and repeat my experiment again I would make sure that the length measurements taken would be as accurate as possible. Also as I said earlier, the width could of increased or decreased in size so if I decided to repeat the experiment I would record width measurements also.
The experiment proved my prediction to a certain degree; I was not expecting the weight loss to go up after a certain point. In my prediction I never really took the solution’s saturation point into consideration. It only dawned on me after I had recorded my results as a graph.