When the gradient of this graph is measured, the EA can be calculated as:
Gradient = - EA
R
Key Variables
Before we can even begin to consider carrying out any practical experiments, the factors of the reaction which when changed might affect the rate of the reaction, must be identified. These factors are known as the key variables, and deciding which to vary, and which to keep constant during the experiment becomes very important when it comes to calculating such things as order of reactions and activation energies.
The following, are all the factors that should be considered when investigating the rate of this reaction:
- The concentration of KI
-
The concentration of H2O2
-
The concentration of H2SO4
-
The concentration of Na2S2O3
- The temperature of the reaction mixture
Trial Experiments
Problem 1
Before it can be decided which of these factors to be controlled in the various experiments, I must acquaint myself with the reaction itself as there are certain points that must be gained:
- To determine exactly which reactants affect the rate of the reaction.
- To choose suitable concentrations of reactants so that the reactions proceed neither too quickly, nor too slow.
In order to gain the required information, trial experiments must be conducted.
Experiment 1
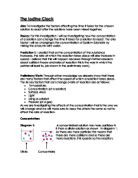
Aim:
In this initial trial experiment, the aim is firstly, to become acquainted with the method and procedure of the experiment; and secondly, to confirm the fact that hydrogen peroxide affects the rate of the reaction.
Apparatus/Equipment:
In these trial experiments, the following apparatus will be used:
-
H2O2 – 5 Vol.
- KI –1.0M
-
H2SO4 – 1.0M
-
Na2S2O3 –0.005M
- 2% starch solution (fresh)
- 50ml burettes (x4)
- conical flasks
- volumetric flasks
- stands and clamps
- funnels
- stopclock
Method
Two conical flasks were taken, in the first was placed 10ml each of KI, H2SO4, and Na2S2O3. In the second conical flask was placed 20ml of H2O2, and two squirts of 2% starch solution from a bulbous pipette. These volumes were measured out using the burettes, with each substance in a separate burette.
The flask containing the peroxide was then poured directly into the second flask, and the stopclock was started simultaneously. The stopclock was then stopped when the reaction was completed, the end point could be observed with a sudden change in colour from an initial colourless solution, to a deep purple solution. The time taken for the reaction to finish was then recorded.
This method was then repeated in exactly the same way, except that the concentration of H2O2 used was diluted down to 2.5 Vol. The results of this second experiment were also recorded.
Results
Analysis of results
In the carrying out of this initial experiment, two points can be deduced:
-
the concentration of H2O2 has an effect on the rate of the reaction
-
in the main experiment, the concentration of H2O2 should perhaps be reduced, as the time taken for the reaction to reach an end point was relatively short. An actual concentration may be deduced through further trial experiments as this may also be effected by the other reactants.
Experiment 2
Aim:
The aim of the following trial experiments is to investigate as in the first trial, which of the remaining substances affect the rate of reaction (i.e. KI, and H2SO4). Through carrying out these experiments, I must also determine which concentrations must be used in the main experiment, bearing in mind the following points:
- Whichever substance is being investigated, the other reactants must be in excess
- When the strongest concentrations are being investigated, the time for the reaction to reach its end point must be long enough to start and stop the timer with accuracy. On the other hand, when the weakest concentrations are being used, the time taken must not be so long that valuable laboratory time is wasted.
Method
The method used was the same as in the first set of trials.
Results
a) Varying the concentration of KI.
Concentrations used:
H2O2 – 2.5M
H2SO4 – 1.0M
Na2S2O3 – 0.05M
b) Varying the concentration of H2SO4.
Concentrations used:
H2O2 – 2.5M
KI – 0.1M
Na2S2O3 – 0.05M
Analysis of Results
After carrying out a second set of trial experiments, and taking into account the results from the initial trial experiments, the following points can now be deduced:
- The rate at which this reaction takes place, is dependant on the concentrations of:
-H2O2
-KI
-
Varying the concentration of H2SO4 had no effect on the rate of reaction, as can be seen from the results. The presence of H2SO4 is required however for the reaction to proceed, it can therefore be deduced that it is acting as a catalyst, and is not a factor that should be investigated.
Problem 2
Before the effects of temperature on reaction rate can be investigated in the main investigation, it is important that the procedure used is accurate, and uses the laboratory time most efficiently. Therefore, I must conduct trial experiments to decide the best method to use, and become acquainted with that method.
Experiment 3
Aim:
To determine the best method of conducting experiments investigating how temperature affects the rate of reaction.
Apparatus:
-
H2O2 – 2 Vol.
- KI –0.1M
-
H2SO4 – 1.0M
-
Na2S2O3 –0.005M
- 2% starch solution
- 50ml burettes (x5)
- conical flasks
- volumetric flasks
- stands and clamps
- funnels
- stopclock
- water bath (i.e. bunsen; tripod etc.)
- test tubes
Method
A water bath was set up and brought to a temperature of 50°C. Two test tubes were taken, in the first was placed:
-
5ml H2SO4
-
5ml Na2S2O3
- 5ml KI
In the second tube was placed 10ml of H2O2; both tubes were placed in the water bath, and left until their solutions were both at a temperature of 50°C. Once the contents of both tubes had reached this temperature, the were mixed and left in the water bath. The time taken for the reaction to finish was recorded, and the experiment was repeated for a second time at 50°C.
Results
The were no valid results gained from these trials, however they illustrated that there were large inaccuracies in the method
Analysis of Results
Although there were no valid results gained from these trials it proved that the method was flawed. Gaining the correct temperature of both solutions using the water bath heated by a bunsen, was almost impossible, the temperature fluctuated constantly. By the nature of the water bath, it also meant that only very few experiments could be heated and prepared at any one time. Bearing in mind that there is limited lab time, this is also not ideal.
Therefore, in the main experiment, a thermostatic water bath will be used that will accurately maintain the temperature of the water, and also be capable of holding a large volume of test tubes at any given time.
Modifications to Key Variables
Now that it has been made clear exactly which substances affect the rate of the reaction, it can be stated exactly which variables are to remain constant, and which to vary.
The following are factors that are to remain constant throughout this experiment:
-
Concentration of H2SO4 – varying the concentration does not affect the rate of the reaction, however the presence of H+ ions is required as they act as a catalyst. Therefore a 1.0M concentration will be used throughout this investigation.
-
Concentration of Na2S2O3 – the presence of thiosulphate ions is required in this experiment as they indicate when the reaction is complete, reacting with the iodine molecules that are produced.
I2 (aq) + 2S2O3 ¯ (aq) 2I¯ (aq) + S406 (aq)
- Pressure (only really applicable with gases)
-
Temperature – this will be kept at room temperature when investigating the ways in which varying the concentration affects the rate. However, part of this investigation is to investigate how the temperature affects the rate of reaction, therefore this will be varied when investigating the effects of temperature.
-
Concentration – the concentration of all of the reactants will be kept constant only when investigating the effects of temperature on the rate of a reaction.
The following are factors that are to be varied, each independently of each other; throughout this investigation:
-
Concentration of H2O2 – through conducting the trial experiments, it has been found that the concentration of H2O2 affects the rate of reaction; therefore the concentration will be varied, and investigated.
- Concentration of KI – this has also been found to affect the rate of reaction; therefore the concentration will be varied, and investigated.
- Temperature of reactants – this is a factor that affects all chemical reactions in the form of the Q10 rule; therefore its effects will be investigated.
Risk Assessment
Before I can start conducting the main experiment, the issue of laboratory safety must be considered so that any possible exposure to risk is avoided. The chemicals, quantities and techniques that are to be used will all be looked at, and assessments will be made.
Procedures
Chemicals:
-
H2SO4 (1.0M)
-
H2O2 (2 Vol.)
- KI (1.0M)
-
Na2S2O3 (1.0M)
Techniques:
- filling of burettes with chemicals stated
- measuring out of specific volumes of chemicals, using burettes
- Initiating chemical reaction through the mixing of two prepared volumes of chemicals.
Hazardous chemicals and nature
-
H2SO4 – this is and acid, and therefore should be handled with care, even though low concentrations are being used. It should not be swallowed or allowed to penetrate the skin as it may have toxic properties at these concentrations. Contact with the skin or eyes must also be avoided as it may be slightly corrosive, but more likely it would cause irritation to the skin.
-
H2O2 – this has similar properties to H2SO4 and therefore the same precautions will be taken.
- Final reaction mixture – this should be handled with care as it contains a mixture of unreacted substances as well as iodine. It should be treated as having the same hazardous properties as above, but also containing iodine which although in this form is not particularly hazardous, has the ability to stain skin and clothing.
Protective measures
When carrying out this investigation and handling these chemicals, certain laboratory safety procedures must be carried out at all times:
- Labs coat must be worn
- Goggles must be worn
- Work areas must be cleared of any unnecessary objects (e.g. bags; books; stools)
The procedures mentioned previously, are all areas where chemicals are being used, and there is certain amount of risk. Therefore when conducting these procedures, extra care and vigilance must be taken; acknowledging these possible risks should result in safe laboratory work.
Units of Concentration
The units of concentration that will be used to measure out H2SO4, Na2S2O3 and KI are mol dm-3 or ‘M’.
In the case of H2O2 however, the concentration will not be measured in mol dm-3, but in ‘Vol.’. Hydrogen peroxide is sold commercially in ‘20 Vol.’ and ‘10 Vol.’ solutions. A 20 Vol. solution of hydrogen peroxide is one that liberates 20 times its own volume of oxygen when heated.
2H2O2 → 2H2O + O2
2 x 34g. 22.41 at standard conditions
If the solution is a 2 Vol. solution of H2O2, (2 x 34g) of H2O2 must be contained in a volume of solution, which is ½ of the volume of oxygen it produces.
Therefore:
A 2Vol. solution contains (34 x 2) x 2 g of hydrogen peroxide per litre;
22.4
that is 6.07g per litre of water.
Therefore, if it was required to calculate the concentration of H2O2 in mol dm-3 for the use in an equation for example, this could now be done.
For 2 Vol. solution of H2O2, the concentration in terms of mol dm-3 is:
Moles = Mass/g
Molar mass/g mol-1
So:
Moles = 6.07 = 0.18
34
If:
Concentration/mol dm-3 = Moles
Volume/ dm-3
Then:
Concentration/mol dm-3 = 0.18 = 0.18
1
Main Investigation – Implementing
-
An Investigation Into The Rate At Which Iodine Is Formed When The Concentration Of Reactants is Varied
Aim
The first part of this investigation is to investigate how varying concentration of H2O2 and KI affects the rate of the reaction.
Apparatus/Chemicals
In this main investigation, the following chemicals and apparatus will be used:
-
H2O2 – 2 Vol.
- KI –1.0M
-
H2SO4 – 1.0M
-
Na2S2O3 –0.005M
- 2% starch solution
- distilled water
- 100ml burette
- 50ml burettes (x4)
- conical flasks
- volumetric flasks
- stands and clamps
- funnels
- stopclock
Method
The five burettes were set up using the stands and clamps, and each was filled with one of the chemical required for the investigation; distilled water was placed in the 100ml burette. Each burette was then labelled accordingly. The first concentration that was investigated, was that of H2O2.
Two conical flasks were taken; in the first was measured out;
-
10ml H2SO4
-
10ml Na2S2O3
- 10ml KI
In the second conical flask was measured out 20ml of H2O2.
Once the two flasks had been prepared, the contents were mixed together, and the stopclock was turned on simultaneously. Once the reaction was completed and the instantaneous colour change was seen, the stopclock was stopped immediately. The time was then recorded, and the experiment was repeated three more times.
This procedure was again repeated another four times, except in the second conical flask was placed a different concentration of H2O2, it contained:
-
18ml H2O2
- 2ml distilled water
This gave an overall concentration 1.8 Vol. of H2O2.
This method was repeated another eight times, and each time the volume of H2O2 in the second conical flask was reduced by 2ml, and the volume of distilled water was increased by two. For each concentration, the experiment was repeated four times; this enabled means and errors to be calculated.
Once all of these experiments had been completed, the concentration of KI was then varied. This was conducted in exactly the same way as the H2O2, However, the total volume of KI used was only ever 10ml; the same number of different concentrations were still tested though.
All of the results were recorded, and tabulated.
2) An Investigation into the Rate at Which Iodine Is Formed when The Temperature of Reactants Is Varied
Aim
The second part of this investigation is to investigate how varying the temperature of the reactants, affects the rate of the reaction.
Apparatus
-
H2O2 – 2 Vol.
- KI –0.1M
-
H2SO4 – 1.0M
-
Na2S2O3 –0.005M
- 2% starch solution
- 50ml burettes (x5)
- conical flasks
- volumetric flasks
- stands and clamps
- funnels
- stopclock
- water bath (thermostatic)
- test tubes
Method
A thermostatically controlled water bath was set up and brought to a temperature of 50°C. Eight test tubes were taken; in each of the first four test tubes was placed:
In each of the remaining test tubes was measured out 20ml of H2O2, and all of the eight tubes were placed into the water bath. Once all of the solutions in all of the test tubes had reached the temperature of 50°C, each of the experiments was then conducted.
Two tubes were taken each containing one of the different solutions; the tube containing the peroxide was then added to the second tube containing the mixture as described above. As soon as the two solutions had been added, the tube containing all of the reactants was placed back into the water bath, and the stopclock was started.
Once the reaction had finished (as seen with an instantaneous colour change from colourless to a deep purple) the stopclock was stopped, and the time was recorded. The method was then repeated using each of the remaining prepared test tubes; all of the results were recorded.
Results
All of the results gained from all of the experiments conducted will now be presented in a series of tables and graphs. In each case, through conducting a large number of experiments it has been possible to gain Maximum, Minimum, and Average results, displaying the occurrence of any anomalies, or inaccuracies in the results. Where possible this has been shown in the graphs, in the form of error bars. Where there are anomalous results that are clearly errors when compared to the other results gained, these results will be discarded, and not included when averages are being taken. If results are to be discarded, then this will be clearly stated.
Table 1- Varying the Concentration of Peroxide
Concentrations/volumes used:
Sulphuric acid – 1.0M; 10cm3
Sodium thiosulphate – 0.005M; 10cm3
Potassium iodide – 1.0M; 10cm3
Table 2 – Varying the Concentration of Iodide Ions
Concentrations/volumes used:
Sulphuric acid – 1.0M; 10cm3
Sodium thiosulphate – 0.005M; 10cm3
Hydrogen peroxide– 2Vol.; 10cm3
Table 3 – Varying the Temperature
Analysis And Conclusions of Results
Now that all of the experiments have been conducted, the results gained that have been displayed in the form of tables and graphs can now be analysed. It may now be possible to draw certain conclusions from the results about the nature of the reaction that has been investigated.
- Order Of The Reaction And The Rate Equation
As already stated in the background information gained at the start of this investigation, it is possible to determine the order of the reaction with respect to each of the reactants, and also the reaction as a whole.
The first and most obvious point to make regards the order of reaction with respect to H2SO4 and Na2S2O3. It was made clear from early on in the investigation through background knowledge and trial experiments the concentration of these two substances does not have an effect on the rate of the reaction. Therefore it can be deduced that the order of reaction with respect to:
-
H2SO4 = Zero Order
-
Na2S2O3 = Zero Order
Through conducting trial experiments however, it was soon deduced that the concentrations of the remaining two reactants (H2O2 and KI) did effect the rate of the reaction, and this can be clearly seen in the results. To determine the nature of how these substances affected the rate of the reaction, it was necessary to plot a number of graphs.
The first set of graphs to be drawn show concentration against time, and were used to calculate half-lives for the various reactions (Graphs 1 and 2). The second set of graphs drawn were identical to the first set, but rather than calculating half-lives, they were used to find the gradient at five points along each graph (Graphs 2 and 5). Calculating the gradient at these points gave the rate of the reaction at five different concentrations. From this a final set of graphs were drawn showing the rate of reaction against concentration (Graphs 3 and 6).
After studying the results gained, and drawing these graphs, it was found that out of all of the results recorded, all were included in the final graphs and used to draw conclusions from. There were no significantly anomalous results recorded, as all of them seemed to follow the same pattern when plotted on the graphs. I felt that there was no reason to ignore or discard any of these results.
For H2O2, Graph 1shows that the half-life increases very gradually, which initially might suggest that the reaction is second order with respect to H2O2. However, this increase is very gradual, and when Graph 3 is studied, it is clear that the rate of the reaction is directly proportional to the concentration. After studying Graph 1 carefully and checking its accuracy alongside the actual results, I have decided that because the increase in the half-lives is only gradual and Graph 3 clearly shows that the rate is proportional to the concentration, this reaction is first order with respect to H2O2.
Graph 1 holds a number of possible areas where errors may occur and this could explain why the half-life is not constant. The actual process of drawing the graphs provides a number of sources for error. Drawing an accurate curve freehand is quite difficult requiring a steady and smooth action, and although this skill can be improved with practise, it still provides sources of error. Also, the calculating of the half-lives requires further drawing using a ruler that is only accurate to the nearest millimetre.
Therefore, after studying the results gained from the experiments, using chemical knowledge, and considering where any errors could have occurred in this analysis, it can be deduced the order of the reaction with respect to H2O2 is first order.
For KI, the results shown in the graphs 4, 5, and 6 show a similar problem as found with H2O2, Graph 4 shows a gradually increasing half-life, and Graph 6 shows clearly that the rate is proportional to the concentration of KI. Therefore, for the same reasons as already stated above for the reactions concerning H2O2, I deduce that the order of the reaction with respect to KI is also first order.
It is now possible to express these results in the form of a rate equation, this will show the order of the reaction with respect to the individual reactants, but will also allow us to determine the overall order of the reaction.
For the reaction studied in this investigation, the rate equation is:
Rate = k [H2O2]1[KI]1[H2SO4]0[Na2S2O3]0
Rate = k [H2O2]1[KI]1
Therefore, the overall order for the reaction is second order.
The units of the rate constant, k are:
mol-1dm3s-1
- Effects of Temperature On Rate Of Reaction, And The Arrhenius Equation
After obtaining the results from investigating how temperature effects the rate of the reaction, Graph 7 shows the ln(rate) against 1/T (K-1). By measuring the gradient of this graph, a value for the activation energy EA can be calculated. The relationship being used is known as the Arrhenius equation:
ln k = C - EA (1/T)
R
The gradient of the graph is equal to -EA
R
Once all of the points had been plotted onto this graph, a line of best fit was then drawn, giving the average and most accurate value for the gradient. However, in order to consider the possible errors that I may have made, I also drew two more lines on the same graph giving the values of the maximum and minimum gradients.
The calculation below shows the activation energy that was calculated from the line giving the average gradient on Graph 7. This is the value that will be used as the final answer.
The gradient of the Graph 7 = -2.5 / 0.000367 = -6811.99
Therefore, the activation energy, EA, for this reaction =
6811.99 x 8.314 = 56634.88 J mol-1
= 56.63 kJ mol-1
Below are the calculations showing the possible maximum and minimum activation energies for this reaction.
Maximum gradient = -1.375 / 0.000087 = -15865.38
Therefore, the activation energy, EA, for this reaction =
15865.38 x 8.134 = 131904.77 J mol-1
= 131.90 kJ mol-1
Minimum gradient = -0.4 / 0.0005 = -800
Therefore, the activation energy, EA, for this reaction =
800 x 8.134 = 6507.2 J mol-1
= 6.51 kJ mol-1
It can therefore be shown quantitatively by just three values from a single graph the possible errors that might exist in the results gained.
Q 10 Rule
The results gained from investigating how the temperature affects the rate of the reaction can now also be used to test the Q 10 rule.
The table below showing just a selection of results gained clearly reinforces the generally accepted rule that as there is a 10° rise in temperature, the reaction time is halved.
Evaluation
Now that the experiment has been conducted and the results have been analysed, I must begin to evaluate the investigation, assessing methodology and results, and identifying both errors and their sources.
Firstly, the reliability of the results should be assessed; can these results be relied upon to give conclusions that show the true patterns, or trends that actually occur in this reaction? I believe that there is no reason to doubt the methodology behind this investigation, the results gained show what was required to see how concentration and temperature affect the rate of reaction. Whether the results compiled show exactly what was happening when the experiments were being conducted, is another question because there may be some doubt about the accuracy of the results.
After assessing the methods and procedures used throughout this investigation, areas where errors may have occurred have been identified, and this may explain some of the uncertainty experienced when analysing the results. Firstly, the various solutions that were being used were not all taken from the same batch of solutions. Due to the allotment of laboratory time, it was impossible to use the same batches of solutions throughout the whole experiment. This was because during the periods when experiments were not being conducted, it was possible that the solutions that were being used may have ‘gone off’, and therefore new batches had to be made up. Therefore, each time a new batch was made up, to say that it was exactly the same concentration as the previous batch would be impossible. And so this is a very real area where errors in the results may have occurred. Modifications that could be made to increase the accuracy would be to only make up one large batch of solutions, and conduct all of the experiments in one go, taking up no more time than perhaps 48 hours.
Secondly, during the preparations of each experiment, the solutions were measured out using burettes that measured to the nearest 0.1cm3 only, and relied on the careful control of the tap. Therefore there is a possibility that volumes were not always measured to the accuracy capable, this may have been due to bad technique, or possibly the fact that there was limited time and a certain amount of pressure to complete all of the practical work. Modifications that could be made to perhaps increase the accuracy of the volumes measured could include using more accurate burettes; spending more time on both practising the technique, and conducting the actual experiment.
Deciphering exactly when the reaction was complete was not always as clear as expected, and this may account for any possible errors. For a number of the experiments conducted, the colour change that indicates when the reaction is complete, was not always as instantaneous as previously described. On these occasions, the colour change was relatively slow, and this made it difficult to determine when exactly the whole of the solution had changed colour. Therefore there may have been some variation in actually deciding the end point of the reaction, which may have lead to errors and inaccuracies in the results. I am not sure why there was variation in the times it took for the actual colour change to occur, and therefore modifications to the method cannot be made, however this opens up the possibility for further investigation.
When the ways in which temperature affected the rate of reaction was investigated, it was decided to use a thermostatically controlled water bath after modifying the original procedure. Although this was much more accurate than using a bunsen to heat the water, the accuracy of the water bath to maintain the desired temperature is questionable. The water bath that was being used seemed to be temperamental and not always particularly accurate, this may have lead to errors in the results. Therefore a modification that might be made could be to perhaps use a more sophisticated and reliable water bath.
Thus, as shown above there numerous possibilities where error may have occurred. These areas of error must therefore be used to explain why the results appeared as they did, making it difficult draw definite conclusions.
Bibliography
‘Chemistry Students Book’ – Nuffield Advanced Science
‘Chemistry In Context’ – Graham Hill And John Holman
‘Basic Inorganic Chemistry’ – Cotton, Wilkinson, Gaus
‘Inorganic And Physical Chemistry’ – A. Holderness
‘Advanced Chemistry’ – P.R.S. Murray
‘Chemistry In Focus’ – John Andrew And Paul Rispoli
‘Chemistry’ – Ken Gadd And Steve Gurr