When plant cells are placed in a solution, which has exactly the same osmotic strength as the cells they are in a state between turgidity and flaccidity. We call this incipient plasmolysis. “Incipient” means, “about to be”.
There are different variables that affect osmosis these are:
Temperature
Size of potato piece
Size of potato cells
Pressure
Light intensity
Concentration of sugar solution
pH of sugar solution
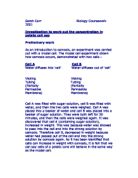
If I am going to conduct a fair test, then I am going to have to control these other factors:
Doing all the tests at one temperature will control the temperature. For the purpose of my experiment I am going to do all the experiments at room temperature.
To keep the water potential of the potato initially will be kept the same by using the same type of potato, which have been treated in the same way, e.g. they have all been washed and peeled. This is a problem because osmosis could have already started in the potato cell
The size of the potato is very important. This is because if the size of the potato varies, so will the amount of mass is looses or gains. I will cut all the pieces of potatoes, to the
same size. We will be given potato chips with the same width and dimensions, but the length of them will differ, (due to potatoes being of uneven shapes). The potato chip will
be 3cm in length. But cut in to three 1 cm pieces
The light intensity will be kept the same by doing all the experiments in the same room, with the same light intensity, (no extra light will be shone on the experiments, nor will
there be any experiments kept in the dark).
The mass of the potato is a dependent variable, and this means that it will be measured throughout the experiment. I will measure the mass in grams. We can assume that the potato pieces in the boiling tubes will have the exact same mass as the others so an average of the mass will also be taken .The potato chip will be weighed before it is put in the solution, and after. This will allow us to see whether osmosis has taken place, and to what extent.
The volume of the solution that the potato chips are kept in must be fair. The potato must be totally covered in the solution, and the amount of solution will be kept the same because all the potato chips are the same size. The amount of solution I cover each chip in will be 5cm.
I have previous knowledge of osmosis with the Visking Tubing experiment. This is where visking tubing is filled with sugar solution with a tube attached to it. It is then placed in a beaker full of pure water. The result of this experiment is that the solution rises up the tube because water enters through the visking tubing through osmosis. The glucose molecules are too big to diffuse out into the water
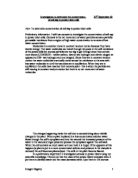
The graph above is my prediction graph. This is roughly what I think my graph will look like when I plot the final results. The top half shows the potato pieces that have increased in mass and the bottom shows the potato pieces that have decreased in mass. The point of intersection of the curve and the x-axis is what the concentration of sucrose in the potato cells is. It should be roughly around about 4%.
Therefore I predict that the potato pieces placed in concentrations of 0-4% will decrease in mass and concentrations of 4-10% will increase negatively according to the sigmoid curve above and 4% is what the concentration of the potato cell should be seeing as that it has not decreased or increased in mass. This is because the cell concentration and the solution concentration is exactly the same and osmosis has not occurred. The formula to figure out the percentage increase is
The potato will be cored giving it the same width and dimensions and then stored in water. Then 6 pieces of the potato will then by dried and cut in to three pieces of 1cm in length, weighed then the pieces will be placed in boiling tubes containing solutions of sucrose, with the concentrations varying from 0%(pure water) – 10%. Three pieces of potato will be placed in each and the volumes of the solution will 5cm. The weight will be given to two decimal places and
The average of the three potato pieces on each boiling tube will be taken. The test tubes would usually be left for 24hours and then taken out of the solutions, dried and weighed again and the average taken.
Results
1st Experiment
2nd Experiment
Percentage Increase
Average Percentage Increase
Analysis
In the first experiment the percentage mass of the potato did change as the percentage sugar concentration increased but instead of increasing negatively it increased positively. In every single boiling tube the mass of the potato decreased. This must’ve occurred because of an error when preparing this experiment.
In the second experiment the percentage increase of the potato increased negatively as I stated it should in my prediction. The only difference here is that it should’ve intersected the x-axis at around 4% instead of 7.7%
My graph is a curve that slopes downwards and does not go through the origin. Because the line is not straight and does not pass through the origin, it means that the percentage gain/loss in mass and concentration of solution are not directly proportional. There is a pattern on my graph, and this is, as the concentration of the sugar solution increases, the percentage increases negatively. None of my results match my prediction as I stated above and the graph doesn’t match my prediction graph. This shows that my results weren’t reliable and something must’ve gone wrong. It is possible that the test tubes could’ve been mixed up and the wrong solution added or that in the first experiment osmosis may have started in the potato cell so when I started the experiment the water would have diffused out of the all the potato cells into the solution rather then just a few.
The average distilled water gains in mass. This means that osmosis takes place and that the water moves from the beaker into the potato. This matches my initial predictions, but doesn’t fit in with my prediction graph. The point where the line crosses the x-axis is the isotonic point. This is where no osmosis is taking place, i.e. no water is moving in or out of the potato. The next point on my average graph, 4% looses approximately 11.0g. This shows that the water potential of the sugar solution in the beaker is weaker than that of the potato chip. The next, 6%, lost approximately 10.0g in mass, a gain of 1.0g. This shows that the sugar solution had stronger water potential than 4% and that osmosis took place. This is one of the anomalous results that occurred. But otherwise the potato lost even more mass, as the sugar concentration increased and it shows that the water potential in the beaker is less than that of the potato chip. This pattern carries on through the graph, and even more mass is loss, as more water moves out of the potato. My results don’t really match with my initial predictions although the shape of my graph is roughly correct. These were that osmosis would take place, and as the water potential decreases, (sugar concentration increases), the percentage change in mass will decrease.
Evaluation
The experiment was easy to do, but all the results I had to take, had to be accurate so I had to change my plan a few times. Things like having the potato chip 3cm long changed to 1cm because it was it was hard to have all the chips 3cm long, and they wouldn’t be able to fit in the test tube. Also, I changed the amount of solution I would keep the potato chips in, because I only needed enough to cover the potato chip.
The range was big enough, but to make it easier to see where the point of intersection was on my graph, I could have taken results of more concentrations, i.e. 0.5%, 1.5%, 2.5%, etc. This way I could have found the isotonic point by there being no change in mass. This would show the water potential of the potato, and this result could then be used further. Also because my first experiment went totally wrong and defied my prediction I could’ve done another two to make sure that it was human error that occurred instead of the one I could have also used cloned potatoes, so that they would have all been the same. I could have also cut the potatoes into doughnut shapes, because the cells in the center of the potato may have a different capacity of water or different water potentials. If I had cut the potato into doughnuts, I would have only been using the out side of the potato, leaving out the middle.
There were anomalous results. This may have been caused by human error, test tubes could’ve been mixed up when labeling or the wrong sugar solution could’ve been added, or my results could have been inaccurate, and changed the average drastically. Or perhaps the potato chip was not cut accurately, or that part of the potatoes, cells did not loose/gain mass well, this may have been because the potatoes were put in water before the experiment and osmosis may have already occurred causing water to diffuse out of all potato cells when I started the experiment. My results did vary a lot for the same concentration. The fact that a certain part of the potato may not be the same as another was shown as the chips all of the same length was not the same weight.
I could extend my enquiry by testing the percentage change in mass with sugar solution using a different substance. By this I mean using a different vegetable. Then I could find out whether osmosis occurs with the same patterns and trends with any vegetable. Such as carrots. The carrot would be cut into 18 pieces with the same length and width. The pieces will then be weighed and the average taken and three pieces will be placed in boiling tubes each containing different sugar concentrations ranging from 0% to 10%. The test tubes will be left for 24 hours and then they would be taken out of the solution weighed again and the average taken. The percentage increase would be found out using the formula.
I could also find out if the same patterns and trends occur in osmosis with different solutions such as salt. I would follow the same method as I mentioned above except I will use salt solution instead of sugar