The convert the distance into measurements of light intensity I have used the formula:
1.
d² where d is the distance from the pond weed.
E.g. id the distance is 0.20 meters the light intensity would be 1.
0.20²
= 25 units
the graph I will draw will only be adjusted to show the light intensity and the number of bubbles produced.
But as you can see the scale so not good enough to find any trends, is I have drawn a second graph which is a section of the one directly below, and so the next graph will all me to find some trends.
As you can see in the second graph as the light intensity increases, as the number of bubbles produced increases until, you get to a point where the rate of increase is slowing down then stays at the same level.+
As you can see in the 1st graph there is a huge difference in the light intensity when the distance is 0.40and 0.20.but as you see there is not much difference in number of bubbles counted. If u look at when the light intensity is about 2.78 units and when the light intensity is about 25 units. Where as if you look at all the results from the when the light intensity is below 1 there is a stead increase and then after one there is still increase but at a decreasing rate. I believe that this is because of limiting factors, such as temperatures, level of CO2.
It a fact the photosynthesis is a reaction, and has many variables which can alter the rate of the reaction. However in plants there are less variables as it a reaction which happens in nature. For photosynthesis is a reaction which needs energy. Light rays are known as a type of energy. The best example of light energy is when it is transferred into electrical energy in solar cells. Plants have been using light energy for the photosynthesis. The products need in photosynthesis is: Carbon Dioxide and Water.
The word equation for the reaction is:
Carbon Dioxide + Water → Glucose + Oxygen
In plant glucose is need as food and oxygen is simple a product that isn’t needed and the plant release the oxygen into the atmosphere by diffusion , this is why the bubble are produce and this is also the very reason why counting the number of bubble tell us how fast the reaction is taking place. Because light energy is needed the more light intensity the grater the rate of reaction and the faster the bubbles are produced. Until the other variables we are changing will have no other effect because of these limiting factors. These limiting factors could be:
Temperature
Level of CO2
And of course the light intensity;
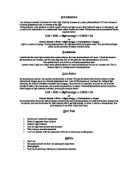
If u look at the sketch of graph of altering these variables you will see that at first there is a steady increase in the rate of photosynthesis but then the rate decreases and stabilizes, the reason why it stables is because of the other limiting factors.
Below is sketch of the graph of showing the effects of increasing light intensity in with two different levels of Carbon dioxide.
Evaluation
I believe that the experiment worked well, and I found that the evidence supported my prediction to a certain extent. This is because the at a certain point the number of bubbles I counted did not change by much, and the at this point increasing the light intensity had no effect...
The procedure that I used was accurate enough for me to come up with good results and a good conclusion. This is because I was able to find patterns and trends in my graphs. I fell that my experiment was successful in a way as it allowed me, to devised reasonably accurate conclusion.
I feel that my experiment was not an accurate, as I did not make much attention to control the other variables which could of distorted my results. as the experiment took place over a long period of time in which the room temperature could of fluctuated. Also if you look my results, for the first attempt at the distance of 0.40 meters I only counted 51 bubbles where as for the other 2 attempts I counted 81, and 84 bubbles. So obviously I have made a mistake in counting the bubbles, as the diffused out the top the pond weed fast and was difficult to count.
In my experiment I recorded a anomalous result, in my first attempt of the distance of 0.40 meters, which was 51 bubbles, where as in my other attempts I recorded 81 and 84 bubbles and so when I was working out my average I did not include the result for the first attempt of this distance as it would of made my results inaccurate . I believe I recorded this error due to human error as when the bubble were diffusing out of the top of the pond weed they were moving quite fast and I may of blinked and missed a few bubbles because of their speed. Obviously this error could of have been avoided if I had used a different apparatus to obtain my results. The method I have used has given me the opportunity to fins anomalous results and how they may be avoided in future.
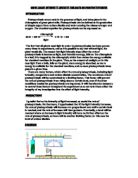
I believe the method used was good to a certain extent but obviously their was room for error to be made and therefore there is room for improvement and so in future if I was to do the same experiment again, I would set up my apparatus so that instead of my self having to count the bubbles, I use some other apparatus so that I could measure the volume of gas that is produced, and there for the measurement will simply tell me exact the volume of gas produced in a minute.
Here is a diagram of how I would setup the experiment:
by doing the experiment this was I would be able to get more accurate results, and also prove if there was any doubt that the bubble are oxygen bubbles, using the collected, gas in the syringe, and putting a glowing splint into it, obviously if it the splint re lit its self I would know that the gas a oxygen.
If I was to extent this investigation I would try to see how other variable can affect the rate of the bubbles being produces:
For example, if I wanted the see how carbon dioxide concentration affected the rate of photosynthesis then I would use different concentration of carbonated water and look for any changes. Also another variable I could investigate would be the temperature of the water in which I place the pond weed and chance the temperatures to find an optimum temperature; I and I would predict for such a experiment that above a certain temperature photosynthesis would stop because the plant cells would die.
Sources for information and Application used :
CGP revision guides ( chemistry & Biology)
Lansdale Science Revision Guide ( Vol 1,2)
MS WORD
MS EXCELL
MS PAINT