Prediction:
In the preliminary work I only used one sample so I cannot predict which of the to samples will be purer. If the limestone sample is totally pure for every 100g, 44g of CO2 will be given off so the higher the loss in mass
Apparatus:
- Balance measured to 0.01g
- Measuring tube to 1 ml
- Stop Clock to 0.01 seconds
- Spatula
- Limestone Samples East and west
- Hydrochloric acid
- Goggles
Plan:
In order to test my prediction a safe and fair experiment must be set up.
- The Independent variable is the samples this is will change using both East and West
-
The Dependant Variable is the amount of C02 produced
- The Control is the amount of reactants
The range across which I will take my data is 3mintues at 15 second intervals because this will give me more accurate results. 3mintues is long enough for the reaction to take place and 15 second intervals provide enough data to draw a graph and conclusions. So after each experiment I will have 13 results I am going to repeat the experiment 3 times with each sample this decreases the margin of error giving me more accurate results also if I repeat three times I can identify any anomalous results and calculate arrearages. Using these averages I can draw a graph to calculate the rate of the reaction. The rate of reaction is affected by four different variables:
-
Temperature, the reaction between CaCO3 +HCL is an exothermic reaction (it produces heat). Even though this will affect the temperature the amount of heat procured will be the same for each sample as the amount of reactions and the duration of the experiment remains constant no more or less heat can be produced so this will not affect the data.
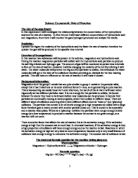
- Surface Area, the form of limestone used is a powered form this increases the surface area as shown below
This will not affect individual results as the same mass of limestone is used therefore the surface area is the same what is will effect is the overall rate of reaction, the overall rate will be faster as its a powder than it would be if it was sold limestone. This will occur when the hydrochloric acid is powered into the conical flask the rate will be extremely high and fast. This will also be reflected in the graph of my results as any anomalous results will be obvious.
The volume of HCL and CaCO3 is chosen measured and kept constant, the amount is 20ml of HCL and 5g of CaCO3, unlike the other variables. The surface area of the CaCO3 changes depending on the way it falls in the conical flask, the weight is calculated but the change in size of surface area may affect my results slightly. Where there is a wide difference across the three tests for a particular time, this maybe the reason. Also the temperature is fixed because there is a set amount of reactants so theses can only reach a certain temperature.
To ensure total accuracy when measuring out the mass of the reactants a balance is needed that weighs to a degree of accuracy of 0.01g this again reduces the margin of error. The HCl, liquid has to be measured in a measuring cylinder this requires skill, as in order for the measurement to exact the eye has to be inline with the meniscus.
2Oml of HCl is required but this measurement needs to be taken from the bottom of the meniscus the eye needs to be inline with the bottom of the meniscus to prevent errors due to parallax. Also the measuring cylinder needs to be placed on a level flat surface and wait for the meniscus is settled and will not move due to an uneven surface.
The CaCO3 is measured in to the conical flask which is already on the balance, in order to weigh accurately and make sure the balance is not over loaded; balances that measure to 0.01g have a maximum weight of 150g, tare or zero the balance before weighing out the limestone. Small amounts of reactions have been chosen so that the scales do not overload the problem this presents is that when weighing out the Limestone sample (CaCO3 ) the stated weigh can easily be increased so use a spatula so that small amounts can be added at one time and make sure the reading on the balance is exact and not flicking between two numbers. Two things will affect the reading on the balance
- If there are any excess reactions on the balance for example powdered limestone on the scales, if there is any this needs to be removed as the sensitivity of the scales will pick up the weight and the mass in the flask will be in accurate
- The balance needs to be placed upon a solid sturdy surface that cannot be knocked or the surface lent on as the extra pressure and weight of a person leaning on the bench would be readjusted by the balance and counted as the mass of reactants. Also if someone knocks the bench this would jerk the scales and most probably mean the maximum weigh is exceeding so the experiment would be ruined.
The scales should not be re zeroed after weighing the mass of CaCO3 as this would affect the results and unless done on every test would not be a fair experiment.
The HCL is added to the CaCO3 whilst still on the balance because as soon as the HCL and CaCO3 are mixed the reaction starts, so not on the balance on data could be taken. As soon as all the HCL has entered the conical flask the 1st data should be taken and the stop clock started, after that at 15minute intervals for three minutes. Repeat the test three times for each sample, the three repeats ensure any anomalous results are identified and an average can be taken.
Risk Assessment:
HCL is used in the experiment, this is of a concentration strong enough to burn the eye and cause blindness so as a precaution goggles should be warn throughout and if any HCl comes in contact with the skin the area should be washed immediately to prevent any burns.
Observations:
Analysis:
Trends and patterns:
The lines shown on the graph are curves of best fit these have been draw so that nay anomalous results can be highlighted. The curve of best shows any data which does not fit the pattern. The shape of a graph for any reaction is:
A smooth curve that levels out at the top this shows the reaction ending. From both samples east and west the curve of best fit is this shape which shows that reaction followed the norm but for each there are two anomalous results.
For East
- (120 , 0.30)
- (165 , 0.32)
For West
- (135 , 0.36)
- (165 , 0.39)
At this points on the graph the data does not fit the curve, both points for east are above the curve so the data is to high and for West the data is to low as they fall below the curve.
Reasons for this:
- Error when taking data, the results might not being taken down probably or after the allotted time
- When calculating the average decrease in mass, which the graph is plotted against a slightly higher/lower result affected the average. So using the mean method of working out an average was not accurate.
Purity Calculations:
From the results of the graph without studying the data west looks to be purer, this is based on the scientific theory that more produced yielded form a reaction the more atoms available to react. So the higher mass of CO2 produced from the reaction the conclusion can be draw that more atoms of HCl or CaCO3 reacted. If the mass of the two reactions do not change and the morality of HCl is 1 then for more CO2 to be produced more atoms of C and O have to be present in CaCO2 thus making it purer. The information stated in the background knowledge it is known that from 10Og of CaCO2 44g of CO2 is produced if the CaCO3 is pure.
To calculate the percentage purity divide 100 by Y. Y represents the mass of CaCO3 used the experiment.
100
Y
This gives the factor (F) by which you multiply 0.44 and the starting mass of CaCO3 used this gives p,
Y x F = p and O.44 x F this gives you the mass of CO2 if the CaCO2 was pure
As the CaCO3 is not pure, percentage purity is needed find this by
p
44 x 100 = % purity
West
CaCO3 CO2
100g 44g
5g 0.43g
X20 x20
100g 8.6g
8.6
44 x 100 = 19.54545455%
= 19.5% (1 dp)
East
100g 44g
5g 0.37
X20 x20
100g 7.4g
7.4
44 x 100 = 16.81818182%
= 16.8% (1 dp)
These calculations give a % purity so the higher the % the purer the limestone. Form the calculations and graph west is the purest as more CO2 was produced form the reactants.
From the results of the graph without studying the data west looks to be purer, this is based on the scientific theory that more produced yielded form a reaction the more atoms available to react. So the higher mass of CO2 produced from the reaction the conclusion can be draw that more atoms of HCl or CaCO3 reacted. If the mass of the two reactions do not change and the morality of HCl is 1 then for more CO2 to be produced more atoms of C and O have to be present in CaCO3 thus making it purer.
Conclusion:
The aim of the investigation was find out which of two samples of limestone was purist. The sample found to be purer by the data collected is west. The proof of this is.
-
From the graph, the curve of the graph follows the proven reaction curve. The two samples are plotted on the same graph so same axis and the curve for the west data is steeper and higher. This shows that the speed of the reaction was higher but also that more C02 was produced. According to the collision theory atoms collide and a reaction occurs the more atoms that collide and join the more of a substance produced. The mass of the product yielded depends upon the amount of reactants
-
The % purity calculations also prove that west was purer. From the calculations the amount of CO2 produced is determined and this also proves that west is purer
Evaluation
The data gathered form the plan I set out was accurate but because of the mass of the reactants used the degree of accuracy of the instruments was not as high as it would have been if smaller masses had of been used.
The volume of HCl was measured in a measuring cylinder that measured to 1ml this was ample enough to gather the data and as 20ml was chosen this was the only cylinder that measured this the cylinders that measured to 0.01ml were to small to measure out 20ml
1
- x 100 = 5.00% (2 dp)
the 5% represents the chance of making an error on measuring the HCl. This 5% does not take in to account human error only machine error. When measuring out liquid the visual axis must line up with the bottom of the Meniscus , which I sated in the plan, and the measurement is taken from the bottom of the meniscus.
Errors due to parallax:
- Movement of the cylinder, the cylinder needs to be totally still so the meniscus is still and can be taken from a steady flat point.
- The line of the visual axis, if the visual axis is above or below the meniscus an accurate result cannot be taken as the eye will perceived it to be in a different place to where its increasing the % chance of error.
Recordings of mass were taken using to mechanical devices, a stop clock and a balance, with both of these a chance of error occurs which is affected by different human errors:
- Movement of the balance
- Extra weigh applied to the surface
- Extra force applied to the actual balance
- Inaccuracies when weighing out reactants not weighing masses exactly so that if 5g mass was stated using 5.01g.
- Not taking results at the set time but after or before
- Not starting the timer after the HCl was pored in but after or before changing the first results
The affect on the results cannot be calculated but the chances of error due to degree of accuracy can be.
Time 0.01
15 x 100 = 0.06666666666 = 0.06% (2 dp)
Mass 0.01
- x 100 = 0.20% (2dp)
Improvements to the plan
Considering the effect of error on the accuracy of the results there is three things I would do to improve the plan.
- Instead of using a large measuring cylinder using tow smaller this would decrease the %chance of error. Also when measuring the HCl to ensure the visual axis is in line with the meniscus to reduced error due to parallax
- Increase the number of tests per sample to four this again would reduce the margin of error. Also it would provide extra data which show anomulas results and four graphs could be draw to show the different decrease in mass for each test, then overlaid so that a check could be produced for the graph.
-
The proof that CO2 was given off and not solids were in the equation. Instead of relaying on the equation set up a control to prove that if the CO2 wasn’t let to escape there would be little or no loss in mass a control.
Diagram to show set up of control:
The control would be set up with the changes made to plan, above, made and the rest as stated in the original plan, instead a bung would be inserted to stop any gasses escaping. This would prove the whole investigation so the evidence gathered could be proved by data as well as equations. Which would make the results more accurate and scientifically accurate.