There are different factors that affect resistance:
Doubling the length of a wire, doubles its resistance
Cross Sectional Area
Thin wire has more resistance than a thick wire
Material
Nichrome has more resistance than copper of the same size
Temperature
For metal conductors, resistance increases with temperature. For semiconductors, it decreases with temperature. (These factors will also be considered for variables)
⎯⎯⎯⎯⎯⎯⎯⎯⎯⎯⎯⎯⎯⎯⎯⎯⎯⎯⎯⎯⎯
⎯⎯⎯⎯⎯⎯⎯⎯⎯⎯⎯⎯⎯⎯⎯⎯⎯⎯⎯⎯⎯
The illustration above shows how electrons give energy to atoms in a conductor colliding with them.
Here I have examples of different resistive wires and their properties:
Wire for an electric fire is an alloy of different metals. It has a high resistance, a high melting point (between 600-700°c) and is chemically stable.
Electric kettle gets no hotter than 100°c, which is the boiling point of water. This is why they all have automatic switches that cut off current.
Infa-red heaters inside glass give off infrared radiation, which warms up room and people in it.
Resistive wires are also used in electrical lighting.
Temperature does have an affect on the resistance of a metal. As metal is warmed the resistance increases. In conductors, some electrons aren’t held very tightly to their atoms resulting in them being able to move through the material passing from atom to atom. Good conductors are also good conductors of heat. Semiconductors behave like insulators when cold but when heated act as poor conductors. In a semiconductor if a metal is heated the resistance decreases. As atoms vibrate, the greater the chance of a collision. This means current is less and resistance is greater.
An example of resistance being calculated:
If there is a voltage of 12 volts across a piece of wire, then there is a current of 4 amperes flowing through it, which means,
Resistance = 12/4 ohms The higher the resistance, the less = 3 ohms current flows for each volt across wire
Resistance and heating Effect
There is always a heating effect whenever a current flows through a piece of wire, this can be seen occurring in heating elements and in the filaments of bulbs, when there is resistance, heat grows on the wire. We can see that the heating effect occurs when electrons collide with atoms as they pass through a conductor, which in this case is a piece of nichrome wire.
The electrons lose energy and slow down but the atoms gain the energy and so vibrate faster. This happens due to the electrons energy being converted to the atoms. As these atoms vibrate faster, the temperature of the wire rises. (we can see this happening two pages previous)
As the atoms vibrate more, the wire (heating element) begins to heat up, toasting the item placed within it.
Investigation
In this investigation we will encounter several variables: length, thickness and type of material. When I investigated how resistance changed with length. I used nichrome wire; I kept the same thickness of wire but changed the length during the experiment.
The steps of my experiment are listed below:
- Obtain my equipment
- Set up the circuit (making sure everything is done safely, by checking that the nichrome wire is not short circuiting, the bench is dry and that the nichrome wire is not touching the bench.)
- Put the nichrome to the test by taking results off the voltmeter and ammeter when the length of the wire is at different lengths. I will record the results in a table from the readings taking of the ammeter (0-5) and voltmeter (0-10).
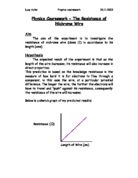
- Plot the graph for resistance against length.
Before doing the experiment I predict that the longer the wire the greater its resistance. The reason for this being the electricity has further to travel and has a lot more atoms to pass in doing so.
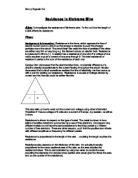
In my experiment, I will use the following apparatus: Battery, voltmeter 0-10, amp meter 0-5, leads and crocodile clips, nichrome wire of different lengths between 0.4m to 1m in intervals of 10cm.
This is a diagram of the apparatus in circuit form:
Predictions
- The longer the wire, the higher the resistance. This is because the longer the wire, the more times the free electrons will collide with other free electrons, the particles making up the metal, and any impurities in the metal. Therefore, more energy is going to be lost in these collisions (as heat).
- Furthermore, doubling the length of the wire will result in double the resistance. This is because by doubling the length of the wire one is also doubling the collisions that will occur, thus doubling the amount of energy lost in these collisions.
For each length of wire, I will record the voltage and current in a table for several different voltages to enable me to work out the resistance of the wire.
Obtaining Evidence
When analysing the experiment we need to give evidence of how we find our results and show things to keep in mind:
∙ When I took down readings from the volt and ammeter I placed them in a table, I got the readings put on the graph by plotting the points that I got from the results of my experiment.
∙ To find the resistance I divided the voltage given by the current given (R=V/I) I than calculated the average and plotted these points on the graph.
∙ In order to find a more accurate result, I will need to take down numerous results to give a more accurate average resistance.
∙ When I take down and record my results, I have to make sure they are taken down accurately by clearly double-checking it. I also need to calculate my results carefully as it is quite easy to make a mistake. To do this I will use a calculator.
∙ I also have to take safety into consideration when doing this experiment, by wearing protective glasses, protective gear and other safety essentials.
Here I have found the averages of the different lengths of nichrome wire ranging from 0.4m to 1m. I have found the mean average by dividing the voltage by the amps then adding the 3 answers and dividing by 3. I now have to plot this table onto a graph. If the table is correct then I should have a straight line plotted on the graph.
Evaluation
I feel I have presented my results in the best possible way. It was suitable to record the results in tables for each wire tested and then produce overall graphs to find if there are any relationships between the variables and the resistance of the wire. You can clearly see that resistance remains constant, meaning each wire does have a set resistance. It’s also obvious from the graphs that the longer the wire the greater the resistance. After investigating the Cross Sectional Area, it proved that as the diameter decreases the resistance gets greater. This shows that my early predictions in my background knowledge proved to be correct. Each graph followed their natural predicted curves.
I think that from my results I can safely say that my prediction was right. The resistance did change in proportion to the length. This is because as the length of the wire increased the electrons that made up the current had to travel through more of the fixed particles in the wire causing more collisions and therefore a higher resistance. We can work out what the resistivity of the wire should be from our results using the formula
It is obvious from the formula that R/l is simply the gradient of the graph.
A way in which my experiment could have been improved was by ‘Data Logging’. This involves the use of a computer and would be the best method. Your readings would be more accurate and voltages and ammeter readings would all be recorded automatically at the click of a mouse. I would have definitely made my results more precise and correct, as there would be no room for human error. I also compared my results with the other results obtained from my classmates to ensure they were accurate enough. Otherwise, I was quite convinced with my own results and the way I have presented the information throughout this study. The longer the wire the more the electrons collide with the others, the particles which are built up to make the metal, more energy will be lost in these collisions. Doubling the length of the wire means doubling the resistance. This is because you’re doubling the amount of collisions that take place. . I also think I could have improved my results if I had of spent more observation time on my experiment. I could have got better and more accurate results in my table if I had more time to study what I was doing.
I feel that overall my results were quite accurate. This can be seen when we look at the graph, which shows a straight line with all of the points going up in a steady increase. With a line of best fit going through them.
Most errors in our experiment were encountered in the measuring of the wire. This is because it simply was not very practical to hold a piece of wire straight, whilst holding it next to a ruler and then trying to accurately fix crocodile clips to the right part on the wire. Also I do not feel that the crocodile clips were always fixed securely to the wire with a good connection. This also meant that they were easy to move about on the wire changing the length of it. Errors rarely occurred in the setting of the current and the reading of the voltage. It was just in the preparation area that they did occur. Another example of this is the wire was never totally straight when we started the experiment, which may also, as said earlier on, affect the resistance of it
I do not think that doing any more results in our experiment would have made it any more accurate. Another way I could have made my results more accurate would be to use a different method – perhaps if i had a bar that did not bend in place of the wire. We could even use a rheostat in place of the wire, because it is essentially a long coiled wire that is connected at different lengths to change the resistance of the circuit.
Overall I feel my results are fairly accurate and I am happy with the outcome of my experiment.