Counting the number of stomata experiment:
-
I predict that many stomata will be found on the bottom of the leaf and none on the top of the leaf. This is because the top of the leaf is covered in a waxy film called a cuticle which prevents water loss; therefore there will be no stomata on the top layer. On the bottom layer, that waxy cuticle still exists but is much thinner, to allow for evaporation from the stomata.
- I predict that there will be the same number of stomata per square millimetre on each leaf. This is because the leaves are on the same plant, and so the genetics of the plant will determine how many stomata there are in a certain area. This will be consistent on all leaves.
Cobalt chloride experiment:
-
I predict that the substance which is given off by the leaves will be water. This is because I know that when we carry out the experiment, we not test the liquid which rests on the leaf’s surface but the liquid which has evaporated. Since water is the only thing that evaporates, I assume (I am in fact very sure) that the liquid will be water. Also, I know this because the plant will only give off what it extracts from the ground. Since we are simulating the ground with an evaporating dish of water, I would assume that the liquid given off is the same liquid that is taken up. An analogy of this is: If you pick up a black pencil crayon, and pass it to the other hand, and then put it down, it will still be black, there is no way in which it could have changed colour. This rule applies to the transpiration.
METHODS:
The Potometer Experiment:
I have previously conducted a preliminary experiment, to help me learn how to use the potometer and to allow me to work out the timings/measurements that I will use. During this experiment, I discovered different factors which affect the rate of transpiration in a plant. These are explained on page 5 under the heading ‘The factors affecting transpiration’.
The Set-up:
We must be very careful when setting up this experiment. If when we insert the plant into the potometer, we get a little air bubble just below the stem, our results will be very wrong, because an air lock would be created, so the plant would not suck up water at all, and therefore experiment would not work at all.
Apparatus needed:
Potometer, Laurel cutting with 16 leaves intact (indeed the number of leaves does not have to be 16, but merely has to be divisible by 4), evaporating dish, water, Vaseline, scalpel (to remove the leaves).
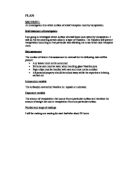
Diagram:
A - Thistle funnel
B - Laurel cut-off holder
C - Laurel cut-off
D - Evaporating dish full of water
E - Capillary tube
F - Ruler to measure distance bubble travels
We will be very vigilant when inserting the Laurel leaf into the cut-off holder. This is because there is a risk of collecting an air bubble at the end of the stem, and therefore, water will not be taken up as an air lock will be in the way. To prevent this, when cutting the cut-off from the bush, we cut the stem diagonally.
Once the Laurel leaf is in the cut-off holder, we will open the valve to bleed the system, to make sure that the only thing in the cut-off holder and the capillary tube is water; any air in the system could ruin the experiment. Before we can even start using the potometer, we will have to make sure that the system is 100% water. Once there is nothing but water in the system, we will remove the evaporating dish so that a bubble will appear in the tube.
As soon as the bubble gets to the 0cm mark on the ruler, the experiment is ready to start.
I have decided that the way I am going to record my results are as follows:
I will keep the time the same rather than the distance. This means that I will choose a time (I have chosen 2 minutes) and see how far my bubble travels, from 0, in that 2 minute period, up to 12 minutes.
The other option is to keep the distance the same, say 5cm, and see how long it takes for the bubble to reach that 5cm mark. I believe that my method will be more efficient because all of the experiments I carry out, with various percentages of the leaves intact, will only last 2 minutes, whereas if I carry out the experiments the other way, once I get down to 25%, it will take a very long time for the bubble to travel 5 cm.
When the bubble gets to the 0cm marker, I will start the stopwatch. Once the stopwatch reaches 2minutes, I will take a note of how far the bubble has travelled. It would increase the accuracy of the experiment if I perform each one about 3 times. So, as soon as I have taken a reading after 2 minutes, I will bleed the system again, to make the bubble go back to the beginning. Then I will reset the stopwatch and repeat the experiment. I will do this 3 times, and work out an average distance for each percentage of leaves.
I have decided that I will take off 25% of the leaves each time. I must make sure that when I take of 4 leaves (25%), I try to take off the leaves randomly, so that even when I only have 4 leaves left, they are evenly distributed about the stem. I must also make sure that I don’t remove 4 large leaves and then 4 small leaves for example, as this would cause more stomata to be removed on each removal of leaves and this would render the results inaccurate.
Once I remove 4 leaves, I must cover the bud where each leaf has been cut off with Vaseline to prevent water loss through the leaf’s ‘stump’. I must make sure I do this for every leaf.
I will perform the experiment mentioned above for 100% leaves intact, 75% leaves intact, 50% leaves intact, and 25% leaves intact.
For each percentage of leaves, I will, as mentioned above, perform the experiment 3 times, and work out an average distance which the bubble travels in 2 minutes.
Since I am going to repeat the experiment 3 times for each percentage, there is a danger that the bubble could go off the scale of the ruler. Therefore, when I repeat the experiment, rather than just count distance on top of the already elapsed distance, I will reset the bubble to 0cm to make sure that I have enough room on the scale to repeat the experiment.
When I remove the leaves, I will try to vary my choice of leaves that I remove. For example, I will not remove all the big ones first or all the little ones first, I will mix up my choice, so that each time I remove 4 leaves, I remove, for example, 2 comparatively small leaves and 2 comparatively large leaves. This means that each 25% that I remove will be contain roughly the same number of stomata. The more similar each 25% is, the more accurate the results for this experiment will be.
I must be careful when removing the leaves with a scalpel as they are exceedingly sharp, and could cause harm if not used properly. Also, the apparatus is made mainly of glass, which is brittle and easily breakable, especially the capillary tubes, which are very thin and vulnerable.
When I remove each 25% of the leaves, I must keep each 25% together. This is because I am going to draw round each leaf, and calculate its surface area. This will enable me to work out how many stomata are on each leaf. Therefore, I must keep each 25% separate so that I know how many stomata, effectively, I removed each time I removed 25% of the leaves.
My results will be most accurate if, when I have calculated how many stomata on each 25% of leaves, each 25% has roughly the same amount of stomata on.
I will type my results for the potometer experiment into Microsoft Excel ™ and make a results table. Once I have a results table, I can use Excel™ to draw a graph, which shows, the rate of transpiration for each leaf division (100%, 75%, 50%, 25%).
When I draw up the graph, I will make sure that all the percentage divisions are on the same graph, to enable me to see, straight away, the difference in the rate of transpiration for the 5 leaf divisions (100%, 75%, 50%, and 25%)
Counting the stomata on a Laurel leaf:
In this experiment, I will attempt to find out the number of stomata on a laurel leaf’s surface.
Apparatus needed:
One laurel leaf, clear nail varnish, senior microscope, glass slide, glass slide cover.
Preparing the leaf for viewing:
What I aim to do is to count the number of stomata on the underside of a laurel leaf using a microscope. A microscope works by shining light through an object, enabling you to see its detail. I cannot just simply place the leaf on the viewing platform as the light would not shine through it, and the lens would just appear black. Therefore, I somehow have to be able just to see one cell deep. I will do this using the following method.
I will apply a layer of clear nail varnish to a small section of the leaf (about 2cm2) and wait for it to dry. When it is completely dry, I will peel it off and place it on a slide, which will previously have had 1 droplet of water applied to it (to stop the nail varnish blowing off). Then I will apply a cover slip on top of the slide/nail varnish. Then I will place the slide on the viewing platform and focus it at 8 x magnification. I will focus on the nail varnish as accurately as possible on 8x magnification and then click round the zoom to 20 x magnification, which will be my final strength. Inserted in the lens is a little round measuring graticule. When you look through the lens with this in, you can see little measuring lines. When I have focussed as accurately as possible on 20 x magnification, I will count how many stomata there are in 3 of these little measurements squared. I will then, using a scale I have been given, calculate how many stomata there are in every cm2. I will then multiply the number of stomata in every cm2 by the surface area of each leaf in cm2 to work out how many stomata (relatively roughly) there are on each leaf.
We use a measuring graticule because if we were just to count the number of stomata in the field of view, we would not be able to translate this value into the number of stomata there are in each cm2 which is vital as the whole point of the experiment is to find out how many stomata there are on the whole leaf, and consequently, on each 25% of leaves; and ultimately to find the relationship between the number of stomata and the rate of transpiration in a plant.
A brief explanation of how to set up a microscope ready for viewing the nail varnish:
- Firstly you must adjust the microscope to its lowest possible magnification (this is, in our case, 8 x magnification).
- You must then adjust the light mirror on the microscope so that the light from a desk lamp shines through the viewing hole in the platform. Before the object is added, the platform must be fully retracted (in the down position).
- Then apply the slide.
- Centre the desired object in the viewfinder and wind up the platform to focus. Also use the major and minor focus wheels to focus the desired object.
- Once the desired object is focussed, you can turn the magnifying column to 20 x magnification, which is where we want it. Then re-focus the microscope at 20x magnification, using the minor focussing wheel.
- Once you have focussed on the desired object, you can then begin to count the stomata in the 3 x 3 square as mentioned above.
I performed this experiment 6 times to get an average number of stomata.
I found that there were stomata on the underside of the leaf, but when I came to count the stomata on the top side of the leaf, the nail varnish did not seem to have any stomata imprints on it. The reason we use clear nail varnish is because it seeps into the stomata, so that is why we can see the stomata, and also, the reason it has to be clear is, when it is on the slide, the light from the mirror has to be able to shine through it. If the nail varnish were coloured, the light would not be able to shine through it and therefore, counting the stomata would be impossible.
The diagram below shows roughly what you should see through the microscope when you are looking for stomata.
This experiment may seem rather safe, but there are still safety aspects which have to be borne in mind.
- The slide and cover slip are both glass and are very thin and vulnerable. They are liable to break, and so extra care must be taken when handling them. Also, when you wind the viewing platform up on the microscope, if you wind too far, it may crack the slide.
- The nail varnish could be very harmful if it is swallowed or comes into contact with your eyes. I believe it is an irritant when in contact with eyes?
Conclusively, I will tie my results in with the results of the potometer experiment. After I have found the number of stomata on the leaves, I can tie it in with the potometer results, and calculate how many stomata were removed on each 25%. I can then use this information to link the number of stomata with the amount of water lost.
Testing the liquid that is given off through the stomata to see if it is water:
In this experiment, I will attempt to find out if the liquid that is evaporating off the leaves is water or not.
Equipment needed:
Paper reinforcement rings, cobalt chloride paper, lamps, stopwatches.
I must make sure that when I start the experiment, I do not let the cobalt chloride paper touch the leaf. Therefore, I will keep the cobalt chloride paper near a hot light bulb, to stop it getting wet. Cobalt chloride paper is blue when dry, but when wetted by water, it turns pink.
I will use the reinforcement rings to separate the cobalt chloride paper from the leaves.
I will start by cutting out little pieces of cobalt chloride paper out (about 1cm2) and sticking reinforcement rings on one side. Then I will give them a quick blast underneath the light to make sure they are blue before I start the experiment.
I will then place the paper, rings down, on the leaf. As soon as I place the paper on the leaf, I will start the stopwatch and time how long it takes for the visible paper to turn completely pink.
I will then repeat the experiment 5 or 6 times, and get an average time.
I will test both surfaces, but I predict that there will be no water given off from the top of the leaf as there are no stomata there, and so no water will come out of the top of the leaf.
This experiment seems the safest of them all, but yet again, it still has some safety aspect to be born in mind.
- When cutting the cobalt chloride paper, beware of sharp scissors.
-
When drying the cobalt chloride paper on the light bulbs, until it turns blue, be careful not to burn yourself on the light bulb or the metallic lamp shade as they both get very hot.
RESULTS:
On the following 7 pages are the results tables for all experiments. Included is the graph to graphically explain the potometer experiment.
Counting the leaves surface areas:
On pages 17, 18, 19 and 20 are the outlines of my leaves that I used in the experiment. Below are the results for this.
Surface Areas of Leaves:
1st 25% off = 325cm2
2nd 25% off = 302cm2
3rd 25% off = 264cm2
4th 25% off = 300cm2
Number of Stomata on each set of leaves removed:
1st 25% off = 646494.9491 stomata
2nd 25% off = 600742.9989 stomata
3rd 25% off = 525152.8202 stomata
4th 25% off = 596764.5684 stomata
Total Surface Area of all 16 leaves:
1191cm2
Total Number of Stomata on all 16 leaves:
2369155.377
ANALYSIS:
Potometer Experiment:
You can see, by looking at the graph named ‘The Distance Travelled by a Bubble in 2 minute Intervals’ that the bubble travelled nearly twice as far with 100% of the leaves intact as it did with 50% of the leaves intact. I believe that if my results were perfect, the bubble would have travelled exactly twice as far. This is because, the amount of water lost through the leaves is directly proportional to the number of stomata that the leaf has.
You can see by looking at the results on the previous page, that the number of stomata on each 25% is not the same. If they were the same (making a perfect experiment), then the bubble would travel, for example, 14cm with 100% of the leaves intact, and 7cm with 50% of the leaves intact. I have noticed the relationship between the number of stomata and the amount of water lost. This is that if you have 100 stomata and so much water is given off, then if you have half the amount of stomata (50), then surely, half the amount of water will be given off.
Similarly, you can see, by looking at the graph on page 15, that the distance travelled by the bubble with 75% of the leaves intact is half way between the distance travelled by the bubble with 100% and 50% leaves intact. This therefore proves my theory that the amount of water lost is directly proportional to the surface area, and therefore number of stomata.
As you can see, there are some anomalous results in my graph, causing the curved line to waver. This is just human error and an explanation of this is in the evaluation.
It is very significant that the lines on the graph are straight (not quite straight but in ideal circumstances, they would be).
This indicates that the amount of water lost is directly proportional to the time. If we talk to 100% leaf coverage for an example; after 2 minutes, the bubble has travelled 2.3cm, and after 4 minutes (twice 2 minutes) the bubble has travelled 4.5cm, nearly twice the distance after 2 minutes. Similarly, if we then take 8 minutes (twice 4 minutes) we can see that it travels 9.1cm, which is, again, nearly twice the value for 4 minutes, which was 4.5cm. This proves that the volume of water given off, indeed the distance that the bubble in the potometer travels is directly related (and directly proportional) to the time it takes to do so.
This means, therefore, that the surface area of the leaf (which is ultimately the number of stomata), the time, and the volume of water that is given off is proportional. This means that by altering one of those factors, we can work out the values for the other two. For example, if with 100 stomata, 1cm3 of water is given off in 100 minutes, then with 50 stomata, only 0.5cm3 of water will be given off. Likewise, with 100 stomata, 2cm3 of water will be given off in 200 minutes.
With this experiment, it would be fairly easy, if we needed to know a value, to work it out, using the two other variables (the three variables being time, volume, and number of stomata).
I can also work out other values in this experiment by looking at my graph. I believe that I made a fairly accurate prediction for this experiment. I predicted that the 3 variables would be proportional, and I was correct, in fact, they have turned out to be directly proportional which is a benefit. Also, I have learned that the number of leaves (more to the point, the surface area of the leaves directly affects the rate of transpiration. I made this as one of my predictions. Overall, I am very happy with my predictions for this experiment, as they have all turned out to be true.
Counting the Stomata Experiment:
One of the factors affecting how much water is evaporated, and the rate of transpiration is the number of stomata.
When I carried out the experiment, I did not find any stomata on the top side of the laurel leaf. In my prediction, I mentioned that I did not think I would, and I have proven my prediction correct.
This is because, I believe, of the waxy cuticle. If the plant’s genetics was going to put stomata on the top side of the leaf, then there would be no waxy cuticle on the top surface of the leaf. Also, the plant needs space on the leaves for the light receiving cells for photosynthesis. These cells are on the top of the leaf, due to the fact that the sun is above the plant, and therefore the tops of the leaves get most sunlight.
Also, if there were stomata on the top surface of the leaf, then the sun would evaporate the surface water much more quickly, causing the plant to need to suck up more water. Therefore, to reduce water usage, nature has put the stomata on the bottom of the leaf, to provide an average level of sunlight. Using this tactic, nature enables sunlight to get to the leaf to evaporate the water, but not excessive amounts.
Also, the tactical positioning of the stomata on the bottom of the leaf protects from other elements, such as wind and rain. It stops too much wind from getting to the leaf to blow off the water, which would cause the plant to use more water. Also, it keeps the underside of the leaf dry (to a degree) so that water will still evaporate. If there is water already on the leaf, then the stomata would not let any more water out.
When I counted the stomata, I did it in a square box on the measuring graticule. On its own, this count is useless, as I don’t know how big each measurement on the graticule is.
I was later given some information which transformed this useless value into a number which I could integrate into the other two experiments. I learned that the box I was using to count in was worth 0.062001mm2 at 20 x magnification. However, I needed my value to be the number of stomata in every cm2 as that was the measurement I used to count the surface area of the leaves. So I took 1cm2 (10mm2) and divided it by 0.062001 to find a multiplier. This means that however many stomata I find on the graticule measurer on 20 x magnification, must be multiplied by the multiplier to find out how many stomata there were per cm2. I could then integrate the results to find out how many stomata there were on each leaf, how many stomata there were on each 25% taken off, and how many stomata I had on the plant before I started.
Cobalt Chloride Experiment:
There is not much to analyse in this experiment. As I predicted, there was nothing given off from the top of the leaves, due to the fact that there are no stomata on the top. Basically, I found that the substance was indeed water. I performed this experiment 10 times, to increase the level of accuracy. I timed how long it took for the cobalt chloride paper to turn from blue to pink. I then worked out the average time it took, which I found to be 335 seconds.
I can conclude that my predictions for this experiment were accurate. I predicted that the substance given off would be water, and I have found that it is.
The speed at which the paper turns from blue to pink could also be used to work out the volume of water vapour produced, but I am not studying this in my coursework, as I do not need to know about this.
EVALUATION:
Potometer Experiment:
This was a very productive experiment. It produced a fantastic set of results which can be used in conjunction with other experiments. The physical side of setting up the experiment is very difficult. When you insert the plant cut-off into the potometer equipment, you have to be incredibly careful not to get an air bubble, which is why we cut the stem at an angle. This cannot really be solved, only by the user’s vigilance in the set up, to make sure that it is perfect. If you begin to conduct the experiment with faulty equipment, it throws all the results out, which can result in an evaluation being wrong. When I set up the equipment, I got an air block where the cut-off enters the equipment and so had to remove it and try again.
Once the cut off is finally in the equipment, you have to bleed the system to make sure there is no air. This again is essential. I would say that the experiment is accurate and efficient, but only the set up instructions are followed accurately. The set up has to be 100% correct to obtain accurate results.
When the stopwatch is started, and the two minute mark comes up (every 2 minutes being the time when a reading has to be taken) it is a little bit frantic looking at the rule to get a distance and then write it down. This will, in every case of the experiment cause human error (unless of course it is performed by an accurate computer). This, along with the previous criticism about the difficulty of setting up the experiment can cause anomalous results.
The difficulty in talking down the readings can be solved by having two people performing the experiment, so that one can look at the stopwatch and tell the other when the 2 minute markers come up, and then the other person can look at the ruler, and note the value. This would not remove the human error, but merely reduce it, and make the risk of an anomalous result less. Overall, the accuracy of this experiment was high (providing that the equipment is set up correctly)
The potometer is designed to measure the water uptake. There is another experiment which can be performed to measure the relative water output of the leaves:
- Take four leaves and cut them from a stem.
- Cover the stump where it has been removed from the stem in Vaseline to stop water escaping.
- On the four leaves, do the following:
-
Cover 1cm2 in Vaseline on the top surface.
-
Cover 1cm2 in Vaseline on the bottom surface.
-
Cover 1cm2 in Vaseline on both surfaces.
- Do not cover the leaf at all.
- Then suspend the leaves from a retort stand and leave them for several days. When you come to check on them, you will see that each one is different. These would be the results:
- Quite shrivelled.
- Not so shrivelled.
- Hardly shrivelled at all.
- Very, very shrivelled.
This is because the Vaseline stops the water from evaporating. We already know that water escapes most from the bottom, and so, when you stop it from escaping via the bottom (b), it makes much more of a difference than if you stop it escaping via the top (a). If you cover both surfaces with Vaseline, it loses even less water (c); however not covering the leaf at all causes it to lose lots of water. This is demonstrated in example (d). We can therefore see that the leaf loses most water through the bottom, but a little water is lost from the top.
In my potometer experiment, I did not receive any anomalous results. I received some results which altered the curve a little, but that was to be expected. I did not collect any data which was off the line. This concludes, for me, that it was a successful experiment.
Counting the Stomata Experiment:
This experiment can be criticised, but I feel there is nothing that could be done to correct it.
The reason I would criticize this experiment is because it relies massively on averages to work. When I counted the number of stomata in the graticule, I only counted 6 times and made an average. This fails because I could have chosen an area on the leaf, all six times, which had a relatively large volume of stomata in relation to the rest of the leaf.
I could never eliminate the problem caused by the relying upon averages; however, I could adapt the experiment to be more accurate. I would do this by taking many more readings. For example, instead of taking readings on one leaf, 6 times; I could take readings on every leaf 10 times. This would increase the accuracy tenfold (because of testing 10 times on each leaf), and increase it 16fold (by testing on every leaf).
This would increase the accuracy hugely but also make the experiment very time consuming to perform.
Another factor which could cause inaccuracy is human error. The person looking down the microscope may decide that stoma that overlap the counting boundary are not to be counted, and then on another test, decide that stoma that overlap the counting boundary are to be counted. This is another case of simple human error. I had to make sure that when I performed the experiment, I chose before hand, which stomata in the field of vision I was going to count and the stomata in the field of vision that I was not going to count. I decided that I would count all the stomata that had at least half of them inside the measuring graticule (3 notches on the graticule). I kept this the same all 6 times that I carried out the experiment to keep a fair test.
I did not collect any anomalous results as such. I collected a range of results between 11 and 14. I still think that if the range were smaller, it would be more accurate. I currently have a range of 4 inclusive. If I had a range of 2 or 3 inclusive, I would have carried out the talk successfully.
Also, I wish that I had collected more results, even if they were from leaf. I carried out the experiment 6 times; whereas I believe that I should have carried it out at least 10 times to reach a good level of accuracy. Overall, however, I am pleased with this experiment. Despite the fact that it has some inaccuracies, it still ties in nicely with the potometer experiment.
Cobalt Chloride Experiment:
I cannot criticize the results of this experiment. I was not out to find a range of results, but just to test if the substance (which we already knew existed) was indeed water. I concluded from this experiment that water was indeed given off by the leaves. More water was given off from the bottom of the leaf than from the top. I know this because of the extra experiment that I have explained under the Potometer heading of the evaluation.
Even though this experiment seems fairly fool proof, human error may still happen (twice in fact).
When you have to dry off the paper before you begin using the lamp, human error may cause you not to dry it off enough, causing the colour-change times to be inaccurate. This could simply be solved by making sure that the paper is dry.
Also, we use paper reinforcement rings to stop the paper from actually coming into physical contact with the leaf. Human error may step in when it comes to putting the prepared paper on the leaf. You have to be vigilant when resting the paper on the leaf because if it is touching the leaf, results may be wrong, due to surface wetness. What we have to remember is that this experiment is see if the evaporate is water, not surface liquid.
Overall this experiment was effective, despite the fact that it was unbelievably tricky to make sure that the paper was not actually touching the leaf.
OVERALL CONCLUSION:
I am very satisfied with all the experiment that I have carried out to complete this coursework.
I have found that there are many factors affecting transpiration in plants. I have learned that the number of leaves, their surface area and ultimately the number of stomata on them have a direct affect on the amount of water that is taken up by the plant.
I have also learned that the plant gives off a substance through its stomata, which I have concluded to be water.
I learned a lot about the transport in plants and transpiration while completing the scientific background part of my coursework. It has helped me to understand how and why all these things are related.