Pilot
Before we start the experiment we must understand how it works. Apart from doing a plan (see below) we shall also have to conduct a pilot experiment. This is to say that we shall do the experiment to see how it is set up, so that we can do it with greater facility, when it comes to doing the real thing. We will also be able to decide which metal to use.
Here we took two readings from both metals in order to decide which we were going to use.
Here as we double the length of wire used for the constantan, so the resistance doubles. The difference is large. For the copper the resistance does not double and there is a smaller gap between the readings. There is also a more accurate change in the resistance. We have decided, therefore, that we shall choose constantan to work with.
Results for pilot
We then proceeded to experiment with the length of constantan we would use.
The difference between 50cm and 51cm is too small. Doing the experiment with 1cm intervals of constantan would not be beneficial. At a 5cm gap there is still a small difference in the resistance. Only when there is a 10cm interval does it become beneficial to do the experiment. We shall, therefore, do the experiment with 10cm intervals from 20cm to 70cm. (20cm-30cm-40cm-50cm-60cm-70cm).
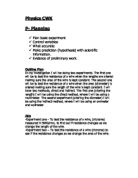
Plan
In our experiment we shall use the following apparatus:
1 power pack.
1 ammeter.
1 voltmeter.
A 100cm ruler.
2 crocodile clips.
5 wire leads.
A 1m length of constantan wire.
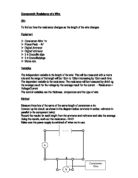
We shall set up the above apparatus as shown in the diagram below.
We shall conduct the experiment as follows.
- Set up the apparatus as above.
- Use the ruler to measure out a set amount of constantan wire. Attach to croc clips (20cm to start with, and then as instructed in the pilot).
- Switch the power pack on to 1 volt. Read off at the ammeter and the voltmeter. Divide the reading from the voltmeter by the reading on the ammeter to find the resistance (as suggested by the equation in the hypothesis).
- Repeat for the different lengths of wire as explained in the results for the pilot section above.
- Be sensible with equipment at all times!
- Repeat. The end of the experiment is nigh.
In the experiment there are four variables we can control whilst conducting the experiment. These are; the length of the wire, the width of the wire, the material of the wire, and the temperature of the wire. We have already decided the material: constantan. The width of a wire would be difficult to change, and highly impractical anyway. In order to ensure it stays the same we shall always take our constantan off the same reel. The length of the wire is the only variable that we shall change. All the rest will stay the same. The temperature must stay the same. This is undoubtedly the hardest of the variables to keep the same. We shall do this by turning off the power supply after each reading. We shall also keep the current running through the wire small, by keeping the power pack on 1 amp at all times. Combined, these should help to prevent the wire from heating up, and hence ensure that the results remain as accurate as possible.
Throughout the experiment we shall endeavour to keep the results as accurate as possible, by following the plan strictly. We shall also take each reading twice.
At the end it should be easy to draw up conclusions from the experiment. We should be able to compare and to contrast the results we found in order to prove or disprove my hypotheses.
Table of results
Analysis
The line of best fit of my points is straight and runs through the origin. This shows that the relationship between resistance and length of wire constantan is direct. None of the points are too far away from the line of best fit. If the wire increases so will the resistance. This shows that there is a positive correlation. It is possible to determine therefore, that the relationship between resistance and length of constantan wire is a strong direct positive correlation.
When the length of wire is 20cm then the resistance is 1.55 ohms. When the length of wire is 40 cm then the resistance is 3.15 ohms. This shows an almost perfect direct relationship (see graph). This proves that if the length of constantan doubles then so does the resistance. Therefore, if the length of constantan halves, then so does the resistance.
When a voltage is put across a metal, the free electrons, which are negatively charged, are attracted to the positive end. They do not take a smooth path however, but rather a ‘drunken’ path as they are knocked off their course by the electron clouds of other atoms. This is the resistance of a metal.
When the length of constantan wire is doubled, then the amount of electron clouds also doubles. This means that the free electrons meet twice as much resistance. This means that the resistance of the length of wire doubles.
This supports my hypothesis closely as I said in my hypothesis that I thought when the length of constantan doubled that the resistance would also doubled. My results proved this. I was correct in my hypothesis.
Evaluation
For the shorter lengths of constantan wire my second result for the resistance matched the first result for resistance, if not exactly, very closely. The results for 20cm, 30cm, and 40cm were accurate. When the length of constantan wire got longer, problems arose. For the 50cm length of constantan wire there was 1 ohm difference - between 3.92 ohms and 4.92 ohms. Although for the 60cm and 70cm readings the differences were not as pronounced, they were still around half an ohm difference. The difference between the voltage readings was usually negligible. It was the readings for the current that caused to disrupt*ion. We should have been more accurate when setting the current through the wire.
I do not feel that our graph shows any anomalous results. We did our experiment with care and precision, and did not expect to find any. There is one very small anomaly that occurred at 30 cm of constantan wire, but this does not change the trend set by the line in any significant way. This may have come about when we were measuring the length of constantan wire needed. It is likely that we did not cut it to the right size, and the wire might have been a bit too long. Our graph suggests that it was about 3cm to long.
Indeed the length of constantan wire used was one of the most important variables that we had to keep right. If the length of constantan wire were exact each time then the line of best fit might have gone exactly through all the points. The crocodile clips would also have had to be placed firmly and accurately on the wire. Being very careful and accurate with these two points would have eradicated any inaccuracies. I know that I kept the width of the constantan wire the same as I took it all from the same reel. The temperature was the same as I did it on the same day, all at once. There would have been no variances in the air temperature due to weather, time of day or even time of year. I did not heat the constantan wire up or cool it. I turned the power pack off for 30 seconds after each reading, to allow the wire to cool down. I also used the same type of wire, constantan, all the time.
If the wire had been heated up then there would have been a curving graph. This means that there would not have been direct proportionality. Indeed if any of the other variables namely length, width, or material had been changed then the results would be different to the ones that I collected. I could have investigated with each one of these variables in order to find different sets of results.
In order to further investigate there are two things that we could have done. First we could investigate with more lengths of constantan wire. Ideally we would use lengths of 1cm intervals between 1cm and 100cm. We could, as a further task, investigate whether all materials are directly proportional to their resistance.