To find out how various concentrations of water affects osmosis in potato cells and to see if any patterns emerge that are related to osmosis.
Osmosis in Plant Cells
Aim
To find out how various concentrations of water affects osmosis in potato cells and to see if any patterns emerge that are related to osmosis.
Background Information
I shall begin this investigation with an explanation of what osmosis is. Osmosis is a special case of diffusion, which involves exchange of water particles across a semi-permeable membrane. Normally diffusion takes place in particles in the form of gas. Diffusion is where a high concentration of particles move over to where there is a low concentration of these particles until there is a state of equilibrium. This is when the particles have become evenly distributed within the volume in which diffusion took place.
Osmosis is very similar to this principle, but will take place across a semi-permeable membrane. A semi-permeable membrane is a wall that has microscopic holes in it. Large particles (E.g. Sucrose, starch, protein etc.) are unable to fit through, as the holes are too small. Smaller particles (E.g. Oxygen, water, carbon dioxide, ammonia, glucose, amino-acids etc.) will be able to fit through these holes. A diagram below shows how this principle works.
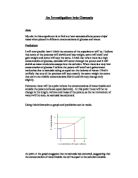
Osmosis occurs when there is a difference in concentrations of water between two sides of water solutions, which are separated by a semi - permeable membrane. Where there is a high concentration of water molecules (e.g. a higher number of available water molecules in a certain volume of solution). And where there is a low concentration of water molecules (a lower number of available water molecules in a comparable volume of solution), which is separated by a semi - permeable membrane.
The dilute solution is said to have a higher osmotic potential and has more available/free water molecules in it. This will dilute the other solution, which has a lower osmotic potential and might have fewer water molecules in it, but more molecules like sugar or salt dissolved within it. The available water molecules will dilute the salt/sugar solution until both sides contain equal strengths of sugar/salt solution. This is known as equilibrium as there is no difference in osmotic potential. This is the basic principle of osmosis. A diagram below shows how osmotic potential works.
I am going to carry out an experiment, which will help to explain and confirm the theory of osmosis.
Prediction & Hypothesis
I predict that by using identical potato chips and placing them in solutions of various solutions of different concentrations, the mass and length of the chips will change, because of the osmosis theory. The chips that are placed in the distilled water will enlarge because the distilled water will dilute the more concentrated solution inside the potato chip. This will continue until there is no difference in osmotic potential, or where a state of equilibrium is reached in concentration strengths. The mass will increase in size, as there will be extra water inside the cells. The lengths will increase in size because the cells inside the potato will become turgid; thus the cells will become larger than normal.
However, the opposite will happen when the chips are placed in more concentrated solutions. In theory, their mass and length will decrease due to the effects of osmosis. This will be because the solution that the potato contains is more dilute than the solution that the chip has been placed in. As the solution inside the potato has a higher osmotic potential, the liquid will move out of the cells to dilute the surrounding solution, thus decreasing the size. The mass will decrease because of the water loss. The lengths will decrease because the cells will all become flaccid from the loss of this water.
Hopefully, a pattern should emerge from the results. I predict that there will be a connection between length and mass.
Plan & Apparatus
The basic part of the plan is to have four pots for each type of solution - salt and sugar. An extra pot will be needed for the distilled water experiment. There will be varying molarities for each type of solution (Moles is the measurement used to indicate how concentrated a solution is. The higher the molarity, the more concentrated it is etc). A chart below displays how many different solutions will be ...
This is a preview of the whole essay
Hopefully, a pattern should emerge from the results. I predict that there will be a connection between length and mass.
Plan & Apparatus
The basic part of the plan is to have four pots for each type of solution - salt and sugar. An extra pot will be needed for the distilled water experiment. There will be varying molarities for each type of solution (Moles is the measurement used to indicate how concentrated a solution is. The higher the molarity, the more concentrated it is etc). A chart below displays how many different solutions will be needed.
Types of Solutions
Sugar
Salt
Distilled Water
Molarity of Solutions
0.2
0.2
pot (0 Moles)
0.4
0.4
0.6
0.6
0.8
0.8
In total, nine pots will be needed. Each pot will contain 25cm³ of each type of solution and I will use two chips for each pot so that I can gain an average. The pots have a base diameter of 50mm, so I shall make the chips 40mm long to allow for extra growth. If I make the chips too long, they might buckle as they increase in size against the sides of the pots. I shall use a borer, so that the whole of the potato chips will have an equal diameter. This will help to improve the accuracy of the experiment. A knife or a scalpel will be used to trim the length of the chips. Safety is a key issue when using these instruments, as care must be taken to ensure that I don't cut myself. A tile will also be used to prevent the surface of the table being scratched. The pots will be covered with aluminium foil to prevent spillage and evaporation, as this may affect the final result. A marker pen will be used to write on any relevant information (e.g. name, solution type and strength) so that each pot can be identified, in case they are swapped around.
The chips will be left for 48 hours. This will allow enough time for osmosis to occur, but prevent the chips from going mouldy. An electronic balance will be used to measure the mass before and after the experiment, the chips will need to be dried before and after the experiment as any surface residue may affect the accuracy of the results. A ruler shall be used to measure the lengths before and after the experiment.
A possible extension to the experiment could be with cucumber strips. By having strips, which contain both dark green cells and light green cells, it is possible to prove that osmosis has occurred as different concentrations affect the cucumber's shape in various ways. However, the main problem with this experiment is that it is difficult to take measurements, as the shape tends to curve, not increase in length.
I have now decided to use 1 potato chip for each pot, as 1 potato does not have enough space to make that many chips of that size. The other option would be to use another potato, but this would make the experiment an unfair test because one of the potatoes might be older than the other potato, and this may affect the rate of osmosis.
Here is a list, which shows the equipment used in the experiment: -
* Potatoes.
* Scalpel/Knife/Borer.
* Tile.
* Rulers/Electronic Balance.
* Solutions - Salt/Sugar (0.2M, 0.4M, 0.6M & 0.8M) and distilled water.
* Marker Pen.
* Paper Towel - to dry surface of potatoes.
* Aluminium Foil - cover to prevent evaporation.
* Scissors.
Here is a diagram showing the apparatus used in the experiment.
Results, Analysis & Conclusion
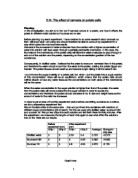
Here is a table of results, which includes percentage change for mass and length. This is to show that the rate of osmosis should be a constant, or maybe a pattern may emerge from the percentage changes, which may be useful when predicting results.
Start
End
Change
Solutions
Mass(g)
Length(mm)
Mass(g)
Length(mm)
Mass (%)
Length (%)
Distilled Water
2.5
40
3.1
45
24.0%
2.5%
Sugar - 0.2 Molar
2.3
40
2.6
42
3.0%
5.0%
Sugar - 0.4 Molar
2.5
40
2.3
39
-8.0%
-2.5%
Sugar - 0.6 Molar
2.6
40
2.0
38
-23.1%
-5.0%
Sugar - 0.8 Molar
2.4
40
.8
36
-25.0%
-10.0%
Salt - 0.2 Molar
2.5
40
2.3
40
-8.0%
0.0%
Salt - 0.4 Molar
2.5
40
2.1
39
-16.0%
-2.5%
Salt - 0.6 Molar
2.5
40
2.0
38
-20.0%
-5.0%
Salt - 0.8 Molar
2.4
40
.9
37
-20.8%
-7.5%
In the table, (g) stands for grams, (mm) stands for millimetres and (%) stands for percentage change.
On the following pages are two hand drawn line graphs, which show the percentage change of the mass in sugar and salt solutions and the change in length in the sugar and salt solutions. I have drawn an approximate line of best fit for each of the results.
Change & Rank
Difference Between Ranks (d)
Solutions
Mass (%)
Rank
Length (%)
Rank
Sugar - 0.8 Molar
-25.0%
-10.0%
0
Sugar - 0.6 Molar
-23.1%
2
-5.0%
2
0
Sugar - 0.4 Molar
-8.0%
3
-2.5%
3
0
Sugar - 0.2 Molar
3.0%
4
5.0%
4
0
Salt - 0.8 Molar
-20.8%
5
-7.5%
5
0
Salt - 0.6 Molar
-20.0%
6
-5.0%
6
0
Salt - 0.4 Molar
-16.0%
7
-2.5%
7
0
Salt - 0.2 Molar
-8.0%
8
0.0%
8
0
Distilled Water
24.0%
9
2.5%
9
0
TOTAL (d)
0
Spearmans Rank = 1 - ((6?(d2))/(N3-N))
Where d = difference and N = number of results
Total (d)
This chart is designed to show how the change in length is linked to the change in height. By using the formula RS = 1 - ((6?(d²))/(N³-N)). This is known as Spearman's rank and is used to determine whether something has a positive or negative or no correlation. It can also determine how good the correlation is. If the result is 1, then that is a perfect positive correlation. If it is -1, then it is a perfect negative correlation. If it is 0, then there is no correlation. Below is a representative diagram showing how this law works.
-1 0 1
My results come out as 1. Therefore, there is a positive correlation between change of mass and change in length, indicating that these are connected. As the length increases, so does the mass, and also the same applies when the length decreases, so does the mass.
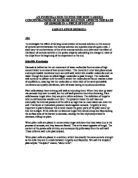
The graphs on the previous graphs show how the results change greatly in terms of percentage loss or gain. Generally, the curve start by dropping steeply, then the rate of change decreases because there is a point in which the potatoes cannot decrease in size. This is because there is a limit to any water that has moved out of the potato cells to dilute the surrounding solution. If the surrounding solution is too strong, then there would be no more water left inside the cells and therefore, they would be unable to further decrease in size. There is also a limit to how large the potato cells can increase in size. Distilled water is the only solution , which will allow the largest increase in size of the cells. This is because distilled water is so pure, that there is nothing else which will further increase the size of the cells. Also, the cells have their own limitations to how much water they can absorb. The cell wall prevents them from increasing in size so much that they burst open. If enough water is absorbed by the cell, a point will be reached whereby it is too difficult for any more water to be absorbed by the cell. The cell is then described as turgid; the water is exerting turgor pressure on the cell wall.
Below are diagrams showing the difference between a turgid cell and a flaccid cell.
The results also show how when the chips are placed in a dilute solution, they increase in size. In a medium concentrated solution, they stay approximately the same size. In a highly concentrated solution, the cells decrease in size.
Below are bullet points showing which category of strength, the solutions belong to.
Dilute Solutions
* Distilled water
* 0.2 Molar sugar
These solutions will increase the size of the chips and are therefore classified as dilute solutions.
Medium Strength Solutions
* 0.4 Molar Sugar
* 0.2 Molar Salt
These solutions will keep the size of the chips approximately the same and are therefore classified as medium strength solutions.
Concentrated Solutions
* 0.6 Molar Sugar
* 0.8 Molar Sugar
* 0.4 Molar Salt
* 0.6 Molar Salt
* 0.8 Molar Salt
These solutions will decrease the size of the potato chips and are therefore classified as concentrated solutions.
On the following page is a computer-generated bar chart, which shows, which of the solutions were dilute, which of them were medium strength and which of them, were concentrated. The bars on the left side of the chart are those which decreased in size and were in a high concentration solution. The bars closest to the centre are those which were in the medium strength solutions. The bars on the right are those solutions, which are dilute and therefore increased the size of the potato chips.
The results of my experiment confirm that my prediction and hypothesis was correct. I accurately predicted that when the chips were placed inside the dilute solution, that they would increase in mass and length. I correctly predicted that when the chips were placed in medium strength solutions, that the chips would stay round about the same mass and length. Also, I precisely predicted that when the chips were placed into a strong concentration solution, that they would decrease in mass and length.
The results show a comparison between the sugar and salt solutions. If I compare the 0.2 molar sugar solution and the 0.2 molar salt solution, it is possible to see a notable difference. The sugar solution increases both its mass and length quite considerably. However, the salt solution decreases its mass, but keeps its length approximately the same. This would indicate that there must already be sugar inside the potato cells as the surrounding sugar solution moved into the cells to dilute its strength difference. Whereas salt cannot be quite so prevalent within the potato cells as some of the water inside the cells has to move out in order to equalise the osmotic potential. If there was more salt inside the potato cells, not so much water would move out of the cells in order to equalise the osmotic difference.
Evaluation
I think that my experiment was very successful. All the results came out as I expected and a pattern emerged from them. The computer-generated graph, which shows the percentage change in length in each of the solutions, clearly shows that the majority of the solutions will cause a decrease in length. The other graphs compare each of the solutions for mass and length. I have drawn lines of best fit where the most appropriate places are to put them. The same downward trend is typical for all variations of the charts. Most the lines are fairly similar in their position to each other indicating that they must be related to one another. By using Spearman's rank, I proved that the length change was connected to the mass change. If the length increased, so did the mass etc. I feel that my results were "perfect," as I got all of the required figures and thoroughly backed up my hypothesis.
There are many ways in which I could have improved the experiment. The main way is the accuracy with which the measurements were taken. When measuring the mass, the electronic balance only went to one decimal place. If I had a more sensitive balance with more decimal places, the results would be greatly improved. As the potato chips were so light, there could be a significant difference in mass and could greatly affect the results. Another factor was that before the chips were weighed, they had to be dried to remove any excess water residue, as this may have affected the mass. Although, this was not a serious issue as my results were adequate. It would also be possible to improve accuracy of the length measurements. I used a ruler, but I could have misjudged the measurements to a small degree. A more accurate device such as a 3D scanner could get more accurate results.
The strengths of the solutions may not have been entirely correct, however, if there was a discrepancy, it would have been too minute to tell the difference. The measurements of the solutions could have been affected by human error. I used 25cm³ of solutions, but it would have been impossible for me to get the measurements the same every time. This may have been because a meniscus formed inside the measuring cylinder, so it was difficult to judge how much solution had been placed into the cylinder. However, I doubt small discrepancies would have affected the results much. Evaporation may have played a part during the experiment, as this may have reduced the final amount of solution, but this is unlikely, as all of the pots had foil lids. I did the experiment all on one day, but if I had done the experiment at another time, the temperature and therefore the volume would have changed slightly when measuring out the solutions.
I only used one chip per pot, but if I had done more, I could have worked out an average change in mass and length for each solution. This would have prevented any unusual results from emerging.
Only specialised computer equipment and computer controlled environments could have made the experiment a completely fair test by having identical measurements and the same environmental conditions. Although, there would be little point in doing this, as there were no anomalous results.
There are no other investigations that could be used to prove the principle of osmosis. I previously mentioned the cucumber experiment, but this would not be as good as the potato experiment as, it would be too difficult to take accurate length measurements. It is only worth conducting an experiment if the results are worth gathering. The measurements are important when conducting an experiment as they help to prove any hypotheses and can show any patterns that emerge.
23/04/07
Andrew Rudhall 11H
Science 1 Biology Investigation
Centre No: 63203 Candidate No: 7152
Page 1 of 8