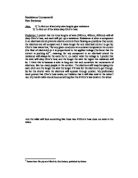
Turn the powerpack on and move the voltage dial to the first mark. In the first test section of the table take the results of the voltage from the voltmeter and the current from the ammeter. Go on to the next mark on the dial until there is a set of six results. Turn all the equipment off. Work out the resistance by dividing the voltage by the current (Resistance(r ) = Voltage (v) ÷ Current (a) ) Repeat the test with the two other lengths of wire. Then re-do the tests two more times for each length of wire, taking the results each time, doing these repeats will help calculate the average results, making them more accurate. Having got three sets of results for each length of wire plot a scatter graph for each collection of results, and for each one it should look roughly like this:
as shown in the preliminary work, because the resistance should be the same each time. The only difference should be the angle of the line of best fit as the resistance should be different for each length of wire. The results will be close and reliable when they are no more than a decimal point away from each other.
Fair test: There are only two things that should change throughout the whole experiment, and these are; the lengths of wires (which are 200mm, 400mm, 600mm) and the voltage goes up for each result. And the dial on the powerpack will be moved for each result. Everything else in the experiment should remain the same to keep all of the tests fair. Each circuit component, except the specific wires, which are the focus of the experiment. The bulb will not be changed. The ruler will not be changed so that the wires are measured accurately to at least one measuring device. None of the components in the circuit should be moved in case the results are affected. The surface the experiment is carried out on should be wooden (not plastic because heated components could melt it) and also remain unchanged, this way there is no chance of the electricity leaking or being electrocuted. The experiment will be repeated two more times for each length of wire, this can ensure a fairly accurate average. Each length of wire, starting with 200mm, is 200mm longer than the last, this is so that if a pattern exists it should be easier to find.
Safety:
- Wear rubber gloves to protect yourself against electrocution and being burnt by overheated electrical components, which was discovered it could happen in the preliminary work.
- Put the equipment on a wooden surface to act as an insulator, not plastic as overheated components could melt that.
- Remove all jewellery, most importantly the metal pieces, an tie long hair back with a non-metal clip.
Results table:
Table to show the current and voltage put through a 600millimeter wire and the resistance it gives
Table to show the current and voltage put through a 400mm wire and the resistance it gives
Table to show the voltage and current put through a 200mm wire and the resistance this wire gives
Graphs:
Conclusion: The 600mm wire had the highest/most resistance whereas the 200mm wire gave the least resistance. This shows that the longer the wire the more resistance it gives.
For the 600mm table the resistance is usually equal for each change of voltage, and remains similar through the repeat tests as well. This proves that Ohm’s law can exist, and that the resistance is the same for any given component in an electrical circuit. In the graphs the marks stick close to the line of best fit. This shows that resistance does exist. The marks in the graph show the resistance of each wire (and this can be worked out by dividing the x axis by the y axis). If the marks stick close to a straight line this means they are following a pattern, and they all share roughly the same resistance. I also noticed that the results in my graph start somewhere midway up the y axis. This is because when using the powerpack the dial read 1 volt for the first reading, but a dial is not an accurate way of reading things and the first mark will be somewhere on either side of the 1 volt mark on the x axis. The current will always be the same for the voltage, that is why the mark is halfway up the y axis for the first reading.
The 600mm wire had the highest resistance, it is possible to see using a couple of pieces of evidence: the line of best fit is steeper than in the two other graphs. The table states that, when the resistance has been worked out, that it has the highest resistance, ranging from 1.4 Ω to 3.32Ω. Where the other two tables show resistance that doesn’t even reach 3.0Ω. The 200mm wire has the lowest resistance; the line of best fit in the graphs is the less steepest and all the resistance in the table are below 1Ω.
This shows that the longer the wire the more resistance it gives. Resistance is when the atoms are more closely packed or there are more of them in an electrical component that it takes a little longer or makes it harder for electrons to jump through and create an electric current. A shorter wire would have less closely packed atoms than a longer one, meaning that it would take longer for the electrons to get through a longer one than a shorter one.
This conclusion has proved everything I have written in my prediction.
Evaluation: There are many reasons for the experiment being a fair test, most of which are already listed under the ‘fair test’ heading, but some things did not work out. The wires were bent and no matter how straight they were when being measured little bends still existed, meaning the wires might have been a millimetre or two above ore below the wanted length, this was one of the problems. But things were kept fair. The wires were measured with the same ruler so that is there was something wrong ith the measuring device the wires were all accurate to the same thing.
There were lots of things that went wrong with the experiment; there were no heat control devices and the whole experiment was done at room temperature. This might have been why some of the results were not exactly on the line of best fit in the graphs. The component needs to be at a constant temperature to follow Ohm’s Law exactly. The voltmeter and ammeter kept changing and flicking between numbers, maybe because of the heat in the circuit or maybe because the powerpack was not totally reliable. Thankfully the spare piece of wire did not have to be used.
The results were close together most of the time but there were a couple of anomalous results. Like for the 400mm; 1.41Ω when most of the results were around 2.8Ω. With the method things could have been explained in greater detail, and with the fair test things could have been done to improve the results. For example not all of the equipment was shown how to be used in great detail, and then there were bits of equipment that will be used in the improvements.
Many improvements could have been made.
There needed to be a heat control device to keep the experiment at a constant temperature.
There needed to be more repeat tests, only to make the averages more accurate. And there could have been lengths of wire 800mm long and 10000mm long, this to prove further that the longer the wire the more resistance it gives. And with more wire lengths it might be easier to spot a pattern in the results.
This investigation could be improved by doing more tests on wires of different thickness. Or maybe to see if resistance is affected by wrapping the wires around a magnet.
Extension Method: Collect together the apparatus mentioned in this method and set it up as shown in the following diagram:
Have the equipment not shown in the diagram on standby. Using a 200mm length of wire wrap it 15 times around a magnet. Connect two crocodile clips to either end of the wire and attach it to the circuit as shown in the diagram. First test that the circuit actually works by turning the powerpack on. If the light bulb lights up then the circuit works, if it does not then there is something wrong with the way it is set up. Switch the ammeter and voltmeter on (make sure the numbers are positive and not negative). The ammeter and voltmeter are important and must be read accurately otherwise the resistance cannot be worked out accurately. Plot four tables that look like the following, one for each length of wire being tested:
Turn the powerpack on and move the dial to the first mark. In the first test section jot the results for the voltage and current from the ammeter and voltmeter. Move the dial onto the next mark and take the results again. Repeat this task again until it has been done seven times in total. Turn all the equipment off and let it cool down for a minute or two. Turn the powerpack back on and repeat the test three more times until the whole table is filled.
With the other three tables repeat all said in the last paragraph for the last three lengths of wire (400mm, 600mm, 800mm).
Having four sets of results for each length of wire , work out the average resistance and plot a scatter graph for each collection of results using the averages. All the marks, if Ohm’s law is unaffected by the magnets presence should be on the line of best fit.
Extract from The physical World by Ken Dobson, published by Nelson