Photosynthesis takes place within the cells, in organelles called chloroplasts that contain the chlorophylls and other chemicals, especially enzymes, necessary for the various reactions. The chemicals involved are organized into units of the chloroplasts called thylakoids, and the pigments are embedded in the thylakoids in subunits called photosystems. Light is absorbed by the pigments, raising their electrons to higher energy levels. The energy is then transferred to a special form of chlorophyll A, called a reaction centre.
Two photosystems, numbered I and II, are recognized. Light energy is first trapped by photosystem II, and the energized electrons are boosted to an electron receptor. They are replaced in photosystem II by electrons from water molecules, and oxygen is released. The energized electrons are passed along an electron transport chain to photosystem I, and energy-rich adenosine triphosphate, or ATP, is generated in the process. Light energy absorbed by photosystem I is then passed to its reaction centre, and energized electrons are boosted to its electron acceptor. They are passed by means of another transport chain to energize the coenzyme nicotinamide adenine dinucleotide phosphate, or NADP, resulting in its reduction to NADPH2. The electrons lost by photosystem I are replaced by those passed along the electron transport chain from photosystem II. The light reaction ends with the energy yield stored in the ATP and NADPH2
The equation for this process is:
6 CO2 + 12 H2 O → C6 H12 O6 + 6 O2 + 6 H2 O
In my preliminary work to this experiment, I conducted a short experiment, to see what type of results I would get. I set up my apparatus as in the diagram earlier in this write-up, and proceeded to wait for the plant to begin photosynthesis. I was surprised by how slowly the plant photosynthesised, as I had been given the idea that it was much quicker. This caused me to change my range of measurements, meaning that I would take eight different distances in the final experiment, rather than the twelve that I had originally hoped for. The preliminary experiment also gave me an idea of how much pondweed to put in and how much NaHCO3 to add. This was good, as I had already decided that these needed to be fixed amounts. Finally it showed me how useful it would be to put a syringe in to re-fill rather than taking the apparatus apart each time.
For my information, I have used many sources, these were:
Microsoft Encarta 2001 Deluxe
DK multimedia sources
National Geographic Interactive
Mosbys Encyclopaedia
Strand II – Obtaining Section
When conducting my experiment, I decided to take eight different light intensities, and repeat each one three times so I am able to take an average for each intensity. My range will be measured as the distance (cm) that the light source is from the plant; this measurement will ignore the heat shield.
The range is as follows: 5 cm
10 cm
15 cm
20 cm
25 cm
30 cm
35 cm
40 cm
My results are shown in the table below.
As you can see from my table, each of the eight different distance readings is repeated three times and then an average is taken to give maximum accuracy. I have tabulated my results to make them easier to view and make conclusions from. In the above table, I have used the units that I feel fit the results best, that is, cm for the distance from the lamp to the plant, mm for the distance the bubble moved and for the average and mm3 for the average bubble volume.
I have put all my distance decimals to 1dp, as I don’t think it would be practical to put them to any more as this wouldn’t be shown on the graph anyway. However, my light intensity values are to many decimal places, this is due to the fact that these are such acute values and the difference between them wouldn’t show up if they were written to 1dp.
In order to ensure I had conducted a fair test and collected accurate results, I have made sure that none of the other variables affected my experiment in any way and that light was my varied factor. I used several tricks to do this; I placed a heat shield between the lamp and the conical flask so that temperature didn’t affect the pondweed, I made sure that I didn’t put an excessive amount of NaHCO3, as this would remove another limiting factor, and finally, I checked that our stop watch was accurate as this could have nullified our entire experiment.
In the table of results, I have highlighted the result, which I think may not be accurate, and certainly isn’t in keeping with the other results at that particular distance. I have also highlighted where it is used in the average, I have then given the average ignoring that result. I didn’t get any other results that I felt were different enough to highlight.
Strand III – Analysis Section
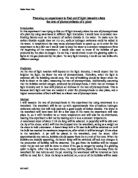
I have looked at my results very carefully and, I can see that they follow my prediction quite closely. As I increased the light intensity value, the rate of photosynthesis increased. In most of my readings, the average didn’t increase by the same rate as the distance from the lamp to the plant, therefore it is impossible to say that there is direct correlation between the two.
The simple graph (above) of my results shows the distance from the lamp to the plant (light intensity) VS the rate of photosynthesis. Rate of photosynthesis is measured as volume per minute of oxygen that is being produced.
I think that my simple graph shows that the rate of photosynthesis affected by the light intensity. Every single average reading I took showed this to be the case. As you can see on the graph, the points form a reasonable curve, proving that as you increase light intensity, the rate of photosynthesis also increases. However, I didn’t find any strict link between the two, they were not directly proportionate.
Strand III – Analysis Section
I have looked at my results very carefully and, I can see that they follow my prediction quite closely. As I increased the light intensity value, the rate of photosynthesis increased. In most of my readings, the average didn’t increase by the same rate as the distance from the lamp to the plant, therefore it is impossible to say that there is direct correlation between the two.
The simple graph (above) of my results shows the distance from the lamp to the plant (light intensity) VS the rate of photosynthesis. Rate of photosynthesis is measured as volume per minute of oxygen that is being produced.
I think that my simple graph shows that the rate of photosynthesis affected by the light intensity. Every single average reading I took showed this to be the case. As you can see on the graph, the points form a reasonable curve, proving that as you increase light intensity, the rate of photosynthesis also increases. However, I didn’t find any strict link between the two, they were not directly proportionate.
In the above graph, I have plotted my results and added a best fit line, as you can see, the plant has almost stopped photosynthesising at 40 cm, this is because another variable has become the limiting factor.
As I increased the light intensity, the rate of photosynthesis also increased. The reason for this is that the higher light intensity stimulated the electrons in the chlorophyll more, thus increasing the amount of oxygen given off by the photosynthetic reaction.
The first step in photosynthesis is the absorption of light by the pigment, chlorophyll, which is the most important of the various pigments in the leaf because it is essential for the photosynthetic process. It captures light energy in the violet and red portions of the spectrum and transforms it into chemical energy through a series of reactions. Different forms of chlorophyll and other pigments known as carotenoids and phycobilins absorb slightly different wavelengths of light and pass the energy to a form of chlorophyll called chlorophyll A for the completion of the transformation process. These accessory pigments thus broaden the spectrum of light energy that can be fixed through photosynthesis. Obviously if a higher intensity of light is provided, then the chlorophyll electrons will be more highly charged, and the reactions will occur at a much faster rate.
Photosynthesis takes place within the cells, in organelles called chloroplasts that contain the chlorophylls and other chemicals, especially enzymes, necessary for the various reactions. The chemicals involved are organized into units of the chloroplasts called thylakoids, and the pigments are embedded in the thylakoids in subunits called photosystems. Light is absorbed by the pigments, raising their electrons to higher energy levels. When more light is applied, the electron energy levels are raised even higher. That is, until another variable becomes the limiting factor, which is what happens at 40 cm on the above graph. The energy is then transferred to a special form of chlorophyll A, called a reaction centre.
Two photosystems, numbered I and II, are recognized. Light energy is first trapped by photosystem II, and the energized electrons are boosted to an electron receptor. They are replaced in photosystem II by electrons from water molecules, and oxygen is released. The energized electrons are passed along an electron transport chain to photosystem I, and energy-rich adenosine triphosphate, or ATP, is generated in the process. Light energy absorbed by photosystem I is then passed to its reaction centre, and energized electrons are boosted to its electron acceptor. They are passed by means of another transport chain to energize the coenzyme nicotinamide adenine dinucleotide phosphate, or NADP, resulting in its reduction to NADPH2. The electrons lost by photosystem I are replaced by those passed along the electron transport chain from photosystem II. The light reaction ends with the energy yield stored in the ATP and NADPH2 .
My results showed that light intensity does affect the rate of photosynthesis. The also showed that any increase in light intensity will result in an increase in the rate of photosynthesis until another variable such as temperature or amount of carbon dioxide becomes the new limiting factor. If that were to be eliminated, then it would be possible to continue to increase light intensity and affect the rate of photosynthesis.
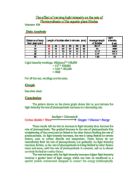
The graph below shows the line of my prediction plotted against the line of my actual. This is good as it shows how close my prediction was. I expected the line to flatten out more towards the end; the actual effect was much less obvious than I was expecting.
Series 1 = Actual Results
Series 2 = Predicted Results
In the above graph, I have plotted my results and added a best fit line, as you can see, the plant has almost stopped photosynthesising at 40 cm, this is because another variable has become the limiting factor.
As I increased the light intensity, the rate of photosynthesis also increased. The reason for this is that the higher light intensity stimulated the electrons in the chlorophyll more, thus increasing the amount of oxygen given off by the photosynthetic reaction.
The first step in photosynthesis is the absorption of light by the pigment, chlorophyll, which is the most important of the various pigments in the leaf because it is essential for the photosynthetic process. It captures light energy in the violet and red portions of the spectrum and transforms it into chemical energy through a series of reactions. Different forms of chlorophyll and other pigments known as carotenoids and phycobilins absorb slightly different wavelengths of light and pass the energy to a form of chlorophyll called chlorophyll A for the completion of the transformation process. These accessory pigments thus broaden the spectrum of light energy that can be fixed through photosynthesis. Obviously if a higher intensity of light is provided, then the chlorophyll electrons will be more highly charged, and the reactions will occur at a much faster rate.
Photosynthesis takes place within the cells, in organelles called chloroplasts that contain the chlorophylls and other chemicals, especially enzymes, necessary for the various reactions. The chemicals involved are organized into units of the chloroplasts called thylakoids, and the pigments are embedded in the thylakoids in subunits called photosystems. Light is absorbed by the pigments, raising their electrons to higher energy levels. When more light is applied, the electron energy levels are raised even higher. That is, until another variable becomes the limiting factor, which is what happens at 40 cm on the above graph. The energy is then transferred to a special form of chlorophyll A, called a reaction centre.
Two photosystems, numbered I and II, are recognized. Light energy is first trapped by photosystem II, and the energized electrons are boosted to an electron receptor. They are replaced in photosystem II by electrons from water molecules, and oxygen is released. The energized electrons are passed along an electron transport chain to photosystem I, and energy-rich adenosine triphosphate, or ATP, is generated in the process. Light energy absorbed by photosystem I is then passed to its reaction centre, and energized electrons are boosted to its electron acceptor. They are passed by means of another transport chain to energize the coenzyme nicotinamide adenine dinucleotide phosphate, or NADP, resulting in its reduction to NADPH2. The electrons lost by photosystem I are replaced by those passed along the electron transport chain from photosystem II. The light reaction ends with the energy yield stored in the ATP and NADPH2 .
My results showed that light intensity does affect the rate of photosynthesis. The also showed that any increase in light intensity will result in an increase in the rate of photosynthesis until another variable such as temperature or amount of carbon dioxide becomes the new limiting factor. If that were to be eliminated, then it would be possible to continue to increase light intensity and affect the rate of photosynthesis.
The graph below shows the line of my prediction plotted against the line of my actual. This is good as it shows how close my prediction was. I expected the line to flatten out more towards the end; the actual effect was much less obvious than I was expecting.
Series 1 = Actual Results
Series 2 = Predicted Results