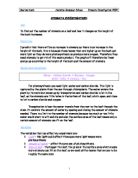
We have to try the hardest to control all the variables, so we will choose the same sized leaf on the height of the bush (because we need to take an average we need to take 3 leaves – so we have to make them the same size for a fair test). Controlling the temperature can only be achieved if we complete all of our selecting on one day so that the temperature is constant. We cant control the amount of carbon dioxide entering it and neither can we control the amount of water entering it, but we will discover which leaves receive more carbon dioxide and release more oxygen as the ones with the greater stomata will need to use up their carbon dioxide. The shadows will not really make a difference to my experiment as we are taking the leaves that are the furthest out from the bush as these are the ones that receive the most carbon dioxide and water etc.
Equipment list
This is what I am going to need for my experiment
- Microscope
- Slide
- Graticule
- Metre ruler
- Nail polish
- A bush
Method
We are going to go outside with the metre ruler and go to a bush towards the back of the field.
- We will need to take three leaves from the ground floor and continue to go up in 0.5m until we reach 2.5m. We have to take three leaves off from each height because we need to get an average of the results.
- After collecting the leaves that we need to carry out our experiment, we will go back into the classroom and set up the microscope (the eye piece of the microscope will have to be opened up so that the Graticule can be placed in it, then we will replace the eye piece)
- We will need the nail polish so that we can paint the back of the leaf, after doing that we will let it dry and then peel off the nail polish from the back of the leaf (the stomata will be printed on the clear nail varnish when it is peeled)
- We will then place the peeled bit of nail varnish on a slide and put it under the microscope and see how much stomata is touching the Graticule.
- We will then record our results and repeat this with the rest of the leaves.
Results
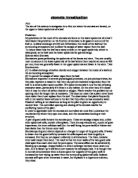
Graph
A graph showing the height of the bush and the amount of stomata it has per leaf which was taken from the same bush each time
A graph showing the gradient of the graph (calculated below)
Calculating the gradient
The general equation for a straight line is; y = mx + c this will help us find out how many stomata there were for every 0.5metres on the bush
Y = dependant variable or calculated value
X = independent or calculated values
M = gradient (or slope) of the line
C = value of the Y intercept (where the line crosses y the axis)
m = y = 5 – 3.6 = 1.4 = 0.56 stomata per 0.5 metres.
x 2.5 2.5
So if we looked at it per metre, on the bush, we would roughly be able to see that there would be approximately 1 stomata on each leaf per metre.
As light was a factor in this we also carried out tests on the amount of light the bush gets by using the light metre at the different heights of the bush
Method
We would get the light metre, go to the same bush from which we took out other data from and take the light readings from each height of the bush. Again we would have to do it three times so that we could take an average so that we could get the best results.
Results
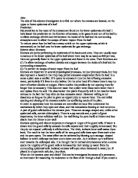
Graphs
Analysing evidence and drawing conclusions
My graphs show various different things. It is clear that in the graph that is showing the number of stomata on a leaf based on the height of the bush, there is a linear relationship between the stomata and the height of the bush, this is what the line of best fit shows. The line of best fit shows the pattern or trend we (think) we would get if we removed all the measurement errors from our experiment. This graph shows that as the bush gets higher the number of stomata increases. This is due to the fact that there is more height on the bush which then means there is more light which finally means more photosynthesis. There is positive correlation in my graph meaning that my results prove that as the height increases the mean number of stomata increases.
In my prediction I mentioned that the graph would be linear which is what was shown. Also the height of the bush and the amount of light it was getting affected the stomata. The results show that as the height of the bush increases the amount of light reaching the bush increases. Therefore when thinking about it in terms of stomata, leaves at the bottom would have less stomata as they would be doing less photosynthesis as there would be a lack of light and the leaves at the top have more stomata meaning they do more photosynthesis.
Again there is a relationship between the height of the bush and the amount of light it receives, as there was also a relationship between the height of the bush and the average amount of stomata.
The results that I got according to my stomata/height graph shows that the dependant variable and independent variable (on the x and y axis) could be proportional, but because I don’t have any scientific figures to prove this in my experiment this theory is flawed. From my graph consisting of the gradient I can conclude that there would be 0.56 stomata per 0.5 metre. My original prediction said
‘There will be an increase in stomata as there is an increase in the height of the bush’
I can add another factor which could relate to this part of my prediction and that is height. The graph showing the amount of light the bush gets shows that as the height of the bush increases, the amount of light reaching the bush increases which would therefore lead to an increase in stomata on those leaves higher up.
Evaluating evidence
For my main experiment I wanted to find out the amount of stomata and how it was affected the height, so I had to take three sets of results for the height/stomata graph and three sets of results for the height/light graph. This had to be done so that I could take an average of all three and have a mean number. This may not be very accurate because the times that we might have done the experiment on may have differed and the days that we had done it on may have differed. But we made sure that all the results we needed were taken on the same day but our results on the height/light graph were a bit mixed up (explained below)
The line of best fit on both of my graphs tells me that none of my results were anomalous on the height/stomata graph which was what I predicted but on the height/light graph it seems there are at least two points that are anomalous. This was because the first readings that we took were not reliable as the sun disappeared behind the clouds but then appeared again causing our results to vary. The second reading that we took had a bit of cloud cover but was constant throughout and the third reading was when the sun was fully out. This was the reason why we had to take three readings so that we could get an average. Our results were still not accurate because we should have taken the light readings when the weather was more stable, these results varied due to the weather. So next time if we were to do this experiment I would make sure that the weather is not going to change, of course the only way I can do this is to look at the weather forecast and see if there is any use in me taking the readings on that particular day. I could have taken more leaves from the different heights, I only took three because I thought that would be enough to get an average but I realised that three was the minimal amount I should have picked up. To get more accurate results I will next time need to collect a greater number of leaves and then compare the results.
I could also have tried to find another bush to take the leaves off, this experiment was carried out on a bush at the back of our field, it may be that the bush is situated in the north and doesn’t get much light because the sun travels from east to west. This experiment would have been more accurate if I had compared different bushes along our field because then I would know for sure my results came out more accurate.
I think if I was to repeat this experiment again I would have to make sure that everything was fair, when I did the experiment this time round I made sure that the leaves were the same size on each height of the bush so that the results were similar, I think next time I will make sure ALL the leaves are the same size but then again the size of the leaf affects the amount of stomata on the leaf, the greater the surface area the more stomata it can fit on the leaf so next time maybe I will investigate whether or not the size of the leaf affects the amount of stomata on it. I would also make sure that the light metre results were fair, as this time all three sets of results that I took were in different conditions (cloudy/sunny/sunny intervals).
The only anomalous results I got were on the height/light part of my experiment which I have tried to justify above, next time it will be more accurate to take the readings in more stable weather. Also relating to the height/stomata part of this experiment I may have chosen leaves that were in a position not receiving enough sunlight, this would obviously influence the amount of stomata on the leaf, so I would have to make sure next time that the leaves were taken from the branch that was furthest out.
There were extensions I could have made to this experiment but did not have enough time to complete, I could have compared results on different types of weather and maybe even try and compare results of different types of bushes.