Preliminary Investigation:
The first investigation we carried out was to look at the effect of concentration on rate of reaction. We used different molarities of hydrochloric acid, and reacted it with marble chips. Both these reactants were placed in a conical flask. As soon as the hydrochloric acid hit the chips a seal was placed over the flask. A tube from the conical flask was connected to a second tube. The second tube was upside-down in a bowl of water, and filled with water. As the marble chips and HCl began to react, carbon dioxide was given off. We allowed 20 seconds each time, and when the time was up, we could see how much CO2 had been given off from the measurements on the second tube. The amount told us how fast the reaction was taking place.
My prediction is that the higher the concentration of HCl the more CO2 that will be given off in the 20 seconds allowed.
The results I obtained were as follows:
Analysis
As can be seen by my results and the graph my prediction was correct. As the molarity increases so does the rate of reaction. When the concentration of HCl was higher more CO2 was given off. This is due to the fact that when the molarity was lower there were less acid particles to react with the marble chips. When there is a higher concentration of acid there are more acid particles, therefore more acid particles collide and the reaction takes place more quickly. The line on the graph proves this, as it is a positive correlation and almost all of the points are exactly on the line. The graph proves that the rate of reaction is directly proportional to the molarity of HCl.
Evaluation
There were two anomalous results when we did the experiment the first time. We repeated the experiment again and the results we got were more accurate. It is the second set of results that is plotted on the graph. There are a couple of reasons why these anomalies may have occurred, and why all of the results may be a little inaccurate. The first is that we used the same marble chips each time. Therefore as they were used in the reaction the marble chips got smaller or broken down and the surface area increased. This means that the HCl would have reacted more quickly as the experiment went on therefore making the results inaccurate. The second reason is that between the time of pouring the HCl into the flask and sealing it some of the CO2 escaped and could not be collected.
This experiment could have been improved by replacing the calcium carbonate with Na2S203 / sodium thiosulphate. When Na2S203 reacts with HCl it forms a cloudy yellow solution, and by placing a conical flask with these two substances in it, on a piece of paper with an ‘X; on it, the rate of reaction can be measured more accurately. As the reaction happens the solution will turn a cloudy yellow colour. When the ‘X’ is no longer visible underneath it the reaction has taken place. By changing the concentration of the acid and timing how long it takes until the ‘X’ is no longer visible it will tell us how fast the reactions are happening. Improving the experiment in this way will mean that more accurate and reliable results will be obtained, as well as being more solid evidence to try and prove that my prediction is correct.
Equipment I will need;
- A conical flask
- A piece of paper with a large cross-drawn on it.
- Measuring cylinders
- A stopwatch
- Pipettes
- Hydrochloric acid - HCl
-
Sodium Thiosulphate - Na2S203
Method
- Draw a large cross on a piece of paper.
- Place a conical flask on top of the piece of paper.
-
Measure out 10cm3 of HCl into a conical flask. (First 0.2M)
-
Measure 50cm3 of Na2S203.
- Get a stopwatch ready.
-
Pour the Na2S203 into the conical flask and start the stopwatch as soon as the the Na2S203 hits the HCl.
- Observe the contents of the conical flask, it should begin to turn a milky colour.
- Stop timing when the cross can no longer be seen due to the sodium precipitate.
- Repeat.
- Repeat again.
*Follow these instructions for each different molarity of hydrochloric acid; 0.2M, 0.5M, 1M, 1.5, 2M
The first concentration I am going to do is 0.2M of HCl. However, because I only have 2M acid I must make up the weaker concentrations myself. To make 0.2M I will measure 1cm3 of HCl into the measuring cylinder and make up the rest with 9cm3 with distilled water. It must be distilled so as to avoid contamination. This is how a made up the 10ml of the other concentrations:
The reaction that takes place is as follows;
Sodium Thiosulphate + Hydrochloric Acid → Sodium Chloride+ Sulphur Dioxide+ Sulphur + Water
(Yellow insoluble
solid – precipitate)
Na2 S2 O3 + 2H+ CL- → 2Na+CL- + SO2 + S + H2O
Fair Test
To make sure the experiment is a fair test I will keep all variables constant other than the concentration of hydrochloric acid. The following things will be kept constant;
-
The amount of HCl – 10cm3
-
The amount of Na2S203 – 50cm3.
- No stirring or shaking of the conical flask can take place.
- The temperature will be kept the same as far as this is possible.
- The same piece of paper with the ‘X’ on it will be used each time.
- The lighting as far as possible as I will use the same room and space in the room.
- We will use the same conical flask each time if possible.
How I will get accurate and reliable results:
To ensure that my results are accurate and reliable and am going to repeat the experiment three times for each molarity. This is so I can identify any anomalous results I get against the other results and also so that I can take an average for the results I believe are accurate. Excluding any anomalous results can do this. I can then work out a reaction rate from my average. I have chosen to do the experiment with 5 different molarities. This is, I believe a wide enough spectrum for me to get accurate results. This should also provide me with an adequate number of points for when I plot my results on graphs. I will check all my results against a second set of back-up results. This is so I can check that both my results and the back-up results show the same patterns and trends. Doing this will make my findings more reliable and will enable me to draw up a more certain analysis.
Safety
The experiment will be kept safe by doing the following things;
- Wearing goggles
- Having good ventilation and ensuring the fumes from the reaction are not inhaled.
- Pouring, measuring and carrying the reactants slowly and carefully.
- Disposing of the solution carefully
- Standing whilst doing the experiment in case the reactants spilled.
- Washing skin immediately under cold water if it comes into contact with the reactants.
- Tucking in ties.
- Tying back long hair.
- Making sure all bags and stools are out of the way so know one can trip over them.
Results
I have now completed the experiment. I have put my results into a table. To check my results my results made sense, I swapped my results with another group’s results therefore I have two tables and I can compare the accuracy of both sets of data.
My results;
NB – results for average time in seconds is correct to 2 decimal places.
The above table shows the results for my experiment. There is a clear pattern which suggests that as concentration increases the time the reaction takes decreases. I have added an average to make the analysis easier and this clearly shows the pattern apart from some anomalous results for 1.5molar and 1molar. This average shows an increase from 1molar to 1.5molar and this does not fit the pattern. The longest time it took to block the cross was 172 seconds. This nearly is nearly 3 minutes, 2minutes: 52seconds to be exact. The shortest time was for 2mol when it took just 77seconds, 1min: 17secs for enough sulphur to precipitate to obscure the cross from view.
I am now going to draw a graph of all my results. From this I should be able to see which results are anomalous and affecting my average. I will then take these anomalous results out and work out the average again using the results that are left which appear to be more accurate. From this I will be able to work out the average rate of reaction. I will then draw two more graphs showing this information.
I have now drawn my first graph (Graph 1). I have plotted all the results on the above table. I can clearly see that some of the results are anomalous and therefore have circled them in green. There is a curve of best fit on graph 1.
Below is a second table showing my results. On this table I have not included the results that I believe to be anomalous. In the table I have recalculated the average excluding the anomalous results. I have also added another column headed ‘Average Rate of reaction’.
Rate of Reaction:
The rate of a reaction is how quickly a reaction takes place. It is a measure of the change that happens in a single unit of time.
I can find the rate of reaction for each of the different concentrations. Providing the depth of the solution remains constant, the point at which the cross disappears will occur each time when the same amount of sulphur is precipitated. The mass (m) will be produced in time (t). N.B. for this formula I will use seconds as the unit for t. So the average rate of reaction will be: m/t
Since m is constant we can write:
I have now redrawn my results table without the anomalous results, recalculated the average and added the rate of the reaction:
NB – Average time of reaction in seconds is correct to 2 decimal places. Average rate of reaction is correct to 4 decimal places.
Results from Graph 1:
On graph 1 I have circled in green the results that I believe to be anomalous, as they do not fit the pattern. I have then drawn a curve of best fit excluding these results. The curve reinforces what I said in my analysis of the results table; there is a strong pattern in my results, as the concentration increases the time of the reaction decreases. However, my graph also shows the amount of decrease in the time the reaction takes between each concentration, decreases as the concentration increases. The curve shows it is an inverse graph; therefore it is a negative correlation.
I will now draw a second graph to show the rate of reaction against concentration. This should show me a positive correlation; therefore the curve should go the opposite way to the curve on graph 1. This is because the rate of reaction increases as the concentration increases.
Results from Graph 2:
I have now drawn my second graph. From my results and the two graphs I have drawn so far I can see that my prediction was correct, the higher the concentration of the reactant, the higher the rate of the reaction, and the shorter time it took for the cross to be obscured from view. Both these statements can be backed up by my results and the graphs I have drawn. Graph 1 shows the time the reactions took against concentration. The curve shows a negative correlation the graph is inverse. Graph 2 shows rate of reaction against concentration. This is a positive correlation the curve shows as one increases the other also increases. The curve is basically very good although the average rate rate of reaction for 1.5M is slightly lower than it seems it should be. Therefore there is a slight dip in the upper end of the graph. I have drawn a dotted line on the graph showing how I think the graph should continue past this 1 point.
Back up Results
To ensure that the results I got are accurate I have got a second set of results to compare my data with. I will be able to check the validity of my results against these and make sure my results are reliable from looking at whether they have similar trends and patterns. I will draw the same graphs as I have done for my results and compare them. I am using a second set of results as if I find all the same trends and patterns a second time, it means all my findings are a lot more accurate as the same outcome would have come from 2 different experiments. The back up results I am using use different molarities of hydrochloric acid this is good because if the same things still occur with different molarities it will make my results a lot more reliable.
Here is the table for my back up results;
*Time – the amount of time in took for the solution to become so cloudy that the cross underneath it was no longer visible.
I am now going to draw a graph for these results, and if there are any anomalies I will be able to identify them.
Results from graph 3:
I have now drawn a graph for the back up results in the table above. On graph 3 I have circled in green the results that I believe to be anomalous, as they do not fit the pattern. I have then drawn a curve of best fit excluding these results. As I expected it shows an inverse curve of best fit (a negative correlation). Therefore it backs up the results I got in graph 1 and reinforces my analysis of graph 1. My graph also shows the decrease in time between each concentration decreases as the concentration increases. The curve mirrors the one in graph 1.
Below is a second table showing my results. On this table I have not included the results that I believe to be anomalous. In the table I have recalculated the average excluding the anomalous results. I have also added another column for the average rate of reaction.
I will now draw a graph with concentration in molars against rate of reaction. I predict that the graph will be very similar to the one I got for my results (graph 2). I think this because the curves on the graphs showing concentration against time of reaction are very similar, and the average rate of reaction is worked out using the average time of reaction.
1÷ average rate of reaction = average rate of reaction
From this graph (4) showing concentration against rate of reaction I can see that all the same trends and patterns are the same as I got when I drew this graph for my results. This is very encouraging as it shows that my results are reliable. The curve is basically very good although the average rate of reaction for 1M is slightly lower than it seems it should be. Therefore there is a slight dip in the upper end of the graph. I have drawn a dotted line on the graph showing how I think the graph should continue past this 1 point. It is interesting how this also happened with my results but for 1.5M. I think it was just a slightly anomalous result for both occasions. Even though it happened in both sets of evidence it happened with 2 different molarities.
Analysis:
From my results and the four graphs I have drawn I can see that my prediction was correct, the higher the concentration of the reactant, the faster the rate of the reaction was, and the longer time it took for the cross to be obscured from view. This can be seen from the graphs I have drawn. Graph 1 shows the time the reaction took against concentration. The curve shows a negative correlation. Graph 2 shows rate of reaction against concentration. This is a positive correlation. The curve shows that as one increases the other also increases. The pattern that can be seen in these results is, as the concentration of hydrochloric acid increases, so does the reaction rate. In other words, reaction rate is directly proportional to concentration. The prediction was also correct when it states that the reaction rate will be directly proportional to the concentration of acid. This is proved both in the results tables and in the graphs. The first and third graphs show that as the molarity increases the time the reaction takes in seconds decreases this is a negative correlation or inverse graph. However the second two graphs show that as the molarity of HCl increases so does the rate of reaction, this is called a positive correlation and proves that reaction rate and molarity are directly proportional to one another. The results that I used for checking backed up both of these statements, as they show the same trends and patterns, this can be seen in the graphs and from the results tables.
I now intend to use scientific evidence to back up my analysis.
In a chemical reaction there has to be two or more substances, these substances are called reactants. In this case they were hydrochloric acid and sodium thiosulphate. Chemical reactions occur when reactant particles collide with one another. They have to collide with sufficient amounts of energy, this minimum energy being the activation energy.
Concentration:
The concentration of a solution means the amount of solution dissolved in a certain amount of solvent. It is normally measured in moles per litre (mol/litre). A highly concentrated solution is a solution with a large amount of the solute dissolved in a particular volume; a highly concentrated solution therefore has more reactant particles than a dilute solution, meaning that there would be a far greater chance of them colliding with other reactant particles in a chemical reaction. As in a concentrated solution there are more collisions per second the rate of reaction is greater and the reaction proceeds more quickly:
The equation for the experiment performed is as follows:
Sodium Thiosulphate + Hydrochloric Acid → Sodium Chloride+ Sulphur Dioxide+ Sulphur + Water
(Yellow insoluble
solid – precipitate)
Na2 S2 O3 + 2H+ CL- → 2Na+CL- + SO2 + S + H2O
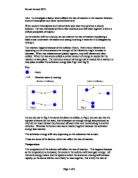
We were changing the concentration of the reactant HCl. This is made up of H+ and Cl¯ ions. The ions reacting to produce the sulphur precipitate were the H+ ions. The greater the concentration of HCl, the more H+ ions there were to collide and react. For every collision between particles, there was a reaction which produced on mole of sulphur precipitate and so the more frequent the collisions were, the greater the amount of sulphur precipitate was produced per second and the faster we could tell the rate of reaction to be.
Increased concentration means increased number of H+ ions…
Low concentration High concentration
…resulting in a greater number of collisions and therefore an increased rate of reaction
My own original results and the back-up results gathered show the same trend in the results; the higher the concentration of the acid, the faster the rate of the reaction. Therefore the data conclusion is supported.
Another finding that can be drawn from the investigation and especially the graphs is that the difference in the time the reaction takes decreases, as the concentration gets higher. This is shown as the line of best fit on my graph is a curve as opposed to a straight line. This is also apparent when looking at the difference in time between the average times, without anomalous results, for 0.5M to 1M was 15.5seconds, but for 1M to 2M it was only 11.167 seconds. When I plotted my results on a rate of reaction graph I could see that the reaction will speed up if a higher molarity is used however the difference between the higher concentrations will be smaller.
My rate of reaction graph also shows a curved line of best fit. This proves to me that the rate does not double when the concentration doubles because, if this were so, I would have a straight line on my graph. The reason it does not double may be because of other molecules in the beaker. The water molecules and sodium ions would block the H+ and the Thiosulphate ions meeting and reacting. Because of these extra particles it means the relationship between HCl concentration and rate is not so simple.
Evaluation
Here is a table showing my set of results. As can be seen from my conclusion graphs and various tables during this experiment I got some anomalous results I have highlighted them in green on the above table and included them in my analysis. I am now going to evaluate what may have caused this to happen.
From all the evidence I gained from this experiment I have drawn up a conclusion. In this conclusion I have identified various different trends and patterns. This conclusion is based on fairly solid reliable results. I believe they are solid because they match the theory I predicted. I am also quite sure that the trends and patterns in my conclusion are reasonably reliable for this experiment, as they are concluded using two sets of results. However I do believe that the experiment had faults, that led to me having anomalous results and graphs that were not quite perfect. This also could have influenced my conclusion making it less accurate than I believe it to be.
In retrospect the method was not as reliable as it could have been and therefore there could have been a number of reasons why the anomalous results and imperfect graphs occurred. The first and most obvious reason is human error. There were a number of things that I or other members in my group could have got wrong. The first and perhaps the main reason were in using our own vision to monitor when the desired point in the reaction was reached (when the cross had disappeared). As a group we could not always agree when this point occurred, because we all saw it differently. We had to compromise with one another. Looking back I would now have allocated this job to 1 member of the group. This would have helped with the problem of differences in opinion. However a better way to solve the problems that using our eyesight caused, which, perhaps created anomalous results, would be to perform the experiment using a light sensor. The investigation would be performed in basically the same way, as before, only a light sensor would be placed under the conical flask, instead of the piece of paper + cross. An amount of light would be decided and, when only this amount was being sensed through the sulphur precipitate, the timing would be stopped. Performing the experiment in this way would provide more evidence to support my conclusion.
There were many other ways where human error could also have played a part. The first of these is in the measuring of the reactants. This was done by hand and eye and therefore a mistake could of easily of happened. There was no way of improving this problem apart from taking more care when measuring them out. Another problem with measuring was the different concentration, because I was adding different amounts of acid and water each time it would have been easy to make a mistake. A better way of doing this would be to make up a large amount of each concentration and take 10ml from that each time. This would also eliminate the problem of using different bottles of 2M hydrochloric acid. This may also have presented me with another problem, as I did not know for sure that the different bottles I used all were exactly 2 molars.
Another area where human error could have also played a part is with the timing. The stopwatch was started when the timer believed the reactants had touched one another. However the moment the timer started the stopwatch most probably varied each time as it would be impossible to get it right every time. Again we were relying on the accuracy of the human eye and hands for pouring the reactants in.
A further problem we encountered was due to the length of the experiment it continued over two days. Although the same room and same place in the room was used I cannot be sure the light intensity or the temperature was the same. It may have been sunny on one day and cloudy on the next. Warm and then cold or the heating may have been on one day and off the next. A way to eliminate the light problem would be to do the experiment in total artificial light. This would allow no variation in light intensity. However the problem involving change in temperature would be impossible to avoid at school.
One other further reason that I got some anomalous results could have been due to the fact that after we had done the experiment each time we washed the conical flask out. We used the same conical flask each time so as to ensure that we did not create various surface areas and also different thicknesses in the glass, meaning that more than one factor was changed. However there was a problem with this. We needed to wash the conical flask out each time, as there was not enough time to allow it to dry. Therefore there was always some excess water left in the bottom of the flask. This meant the reactants would be slightly more diluted than we thought.
A suggestion of inaccurate method is anomalous results. These I have highlighted on my graph and left out when recalculating my rate of reaction. There are three of them. The first is for 0.2M and is a whole 36 seconds slower than the nearest result. The next one is for 0.5M and is 13 seconds slower and the final one is for 1.5M and is only 5 seconds off its nearest yet is clearly away of the line of best fit. There are several possible reasons for these anomalous results. However, I feel it is most likely to be down to the faulty concentration of acid and the difficulty judging when the reaction had reached the end point.
If I were to repeat the experiment I would make some alterations. Firstly I would improve as many of the above things as possible within the confines of school. I would repeat the experiment more times for each concentration and would also extend it in other ways. These could involve doing more concentrations within my range or dong a wider range of concentrations. I could also look at the other variables of this reaction, such as catalysts, or look at other reactions and the concentration of one of the reactants affects them. I could also use the computerised light sensor instead of doing it by eye.
To further this investigation I could perform a different experiment. I would be interested in doing an experiment to investigate whether temperature or molarity has a bigger influence on time of reaction. To do this I would repeat the experiment above making the changes I have already outlined including the use of the light sensor. However for each concentration I would change the temperature. Sot eh first three times I would put ice around the beaker containing the reactants. I would make sure both the reactants were the right temperature separately (using ice for example) with a thermometer. I would then make sure they were sustained at that temperature for the experiment. I would repeat this three times for each concentration. I would then do it at room temperature and then do the experiments while the reactants are hot. However I will have to be careful not to evaporate any of the solution. From this information I should be able to compare the extent temperature has on rate of reaction with the extent molarity has on the rate of reaction.
Ruth Fitzpatrick 11S