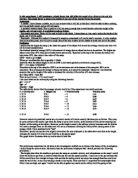
Results (preliminary)
Trolley
Time in seconds it took the object
to travel down the ramp.
Ping-Pong Ball
Time in seconds it took the object to
travel down the ramp
Marble
Time in seconds it took the object to
travel down the ramp
Using these preliminary results, we decided that we would use the object with the greater range of results, which was the ping pong ball.
Method
Apparatus
Ramp,
Ping pong Ball,
Metre rule,
Stop clock,
Way of raising the ramp, i.e. books.
Reasons for using these Apparatus:
Stop clock: we decided to use a digital stop clock, as it would be more accurate than an analogue one, as the readings would be digital.
Metre Rule: Using a metre rule to measure the length of the ramp was more accurate than using, for example and 15cm ruler, as you could measure greater distances at a time instead of moving the ruler.
Step-by-Step
- Using the preliminary results, decide which object is going to be used to travel down the ramp (Ping-Pong ball in this case)
- Set the ramp up to the first height (0.10m) using a stool and some books if necessary
- Use black tape to mark off 2.10m on the ramp.
- Start the Ping-Pong ball at the first black strip, ensuring the stop clock is started as soon as the ball crosses the line
- Stop the stop clock when the Ping-Pong ball reaches the second black line
- Record results, repeat two mores times to try and eliminate any anomalies that could occur and repeat with the next heights, 0.20m, 0.30m, 0.40m, 0.50m
Observations
Results
How I calculated my values:
We used a digital stop clock (more accurate than an analogue stop clock) to get the data for the time it would take the object to travel down the ramp.
We measured the height of the ramp and the distance travelled with a metre rule.
I got my values for average time by adding all the tests together then dividing by 3.
From having the average time I could then find out the average speed by dividing distance travelled (2.10m) by time taken (average speed in secs).
After getting the values for the average speed I worked out the values for final speed by multiplying the average speed by 2. (basically d/t x 2).
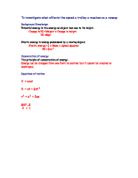
Analysis
I found from my results that my prediction was correct and that as the height that the ramp is raised to increases, the speed of the object at the end of the ramp increases. This is due to the fact that energy cannot be lost or used up; at the top of the ramp the ball has gravitational potential energy, which is converted to kinetic energy, the higher the kinetic energy is (and therefore the gravitational potential energy) the faster the speed of the object at the end of the ramp will be. Gravitational potential energy is stored until it is converted to kinetic energy once the ball begins to move. Conservation of energy states that mgh= 1/2mv (mgh =gpe). 1/2mv is the kinetic energy.
The raw data shows a definite relationship between height of the ramp and final speed, which supports my prediction. For example compare the result for the first height and the last height:
This shows that as the height increases the final speed increases. This means that they are directly proportional to each other.
By looking at the graph that shows the relationship between height and final speed, we can tell that the line of best fit is curved. This means that at some point the line must level out into a plateau. My points and my line of best fit are not that close to the points and line of best fit of the predicted values, my values are lower than the predicted values. This may be due to human error, such as delayed reaction times when stopping the stop clock or it could be due the object hitting the sides of the ramp. Another reason could be that the heights the ramp was raised to may have been slightly incorrect as we were using books to raise the ramp, which is not very professional and could have caused error. However both the lines curve in a similar way so we can assume that the experiment was conducted as fairly and accurately as possible with the apparatus available.
The graph has been fairly accurately drawn as the points were plotted with care and the line goes through the origin, so we can assume the reason for difference between the lines of best fit for both predicted and actual values is not due to the graph being drawn inaccurately.
Frictional force may be another reason as to why the lines of best fit for predicted and actual values differ, as if the frictional force is greater i.e. the surface the object is travelling on is rough, then the kinetic energy from the ball would be converted into more heat energy as it is travelling down a rough ramp.
The average speed of the object travelling down the ramp also has a relationship between heights. This is expected as it is due to the Average speed that we find the final speed (multiply the average speed by 2).
Another way of showing my evidence
Evaluation
The anomaly that is apparent on the graph that shows the relation between height and final speed could be due to human error, as we had to be responsible for stopping the stop clock when we thought it had crossed the black line and human reactions can vary. Using a light sensor attached to a computer, which would record the time it took the object to travel down a set distance, could have eliminated this problem. The problem with this solution is that the ping-pong ball may not be large enough for the light sensors to pick it up. Another reason as to why an anomaly might occur is the object hitting the edge of the ramp as it travelled down it, this would alter the final speed, most likely making it less.
Extending the Experiment
Other variables could have been the shape of object, length of runway and frictional force, all these would give different results and would aid the investigation. Mass of object however could not be a variable, as final speed only depends on 2xgxh, not mass.
Frictional Force as a variable would affect the experiment by making the object travel faster or slower down the ramp. This is because if the frictional force is higher the kinetic energy of the object is converted into heat and therefore making the speed of the object at the end of the ramp less, and vice versa. We could polish the surface that the object was to travel down or use different materials to change the amount of friction. However this is not a quantifiable variable, it is categoric.
If we used the length of the runway as a variable then if the length of the runway is longer then the time taken for the object to travel down the ramp would be greater, as the object would have further to travel. If the length of the runway is shorter, then the time taken for the object to travel down the ramp would be less, as the object would have less distance to travel.
The shape of the object would affect the experiment, because some objects will be more streamlined and therefore there would be less air resistance, so the speed of the object at the end of the ramp would be greater (a good example of this is racing cars, as they are more streamlined to help them travel faster). If the object were less streamlined and more bulky then the speed of the object at the end of the ramp would be less, however the object still needs to be able to move, so the object would have to have wheels, like a car.
Improving the Plan
To improve the plan, we could have probably used more heights or a greater range of heights. Or we could have been more careful to avoid any human errors that could have occurred.
Another possible investigation using different apparatus:
Apparatus:
Ramp,
Light sensor attached to a computer,
Object to travel down the runway (ping pong ball, trolley, marble)
A way to raise the ramp.
Step-by-Step
- Set the apparatus up as shown in the diagram
- Start the object at the first sensor
- The computer will record the data from the object travelling down the ramp, and then the experiment should be repeated two more times to try and ensure that an anomaly will not occur, then repeat for the other heights, 0.20m, 0.30m, 0.40m, 0.50m.
You could also use something that would release the ball, to ensure that there is no human error, e.g. if the human accidentally pushed the ball a bit down the ramp, this would make the results unreliable.
Reliability
I believe that this experiment is reliable as all that was possible was done to ensure that anomalies would not occur. We can also assume the experiment is reliable as the results correspond with the prediction.
Other than these possible reasons I can conclude that the experiment was conducted as fairly and accurately as possible with the equipment and conditions that we were operating in and that the results and the data collected are as accurate as possible, however there are ways in which the experiment could have been improved, as shown above.