Plan:
I have chosen to collect the gas using an over turned measuring cylinder, because if I used a gas syringe the pressure in the lower concentrations may not be high enough to move the syringe.
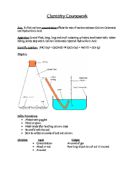
First you fill up the water bowl with water, and fill the measuring cylinder up so there are no air pockets and then turn it over in the water and insert one end of the delivery tube (not the bung).
Measure out 1.45 grams of marble chips. (In my preliminaries we are testing to see whether it is best to use powder, large, or small) In the conical flask pour the correct amount of acid and water; together they should be 50cm3 in total volume, for the preliminaries use a ratio of 1:4 (acid: water), 3:2 and 5:0. Then add the marble chips to the solution in the conical flask and put in the bung from the delivery tube in the top and start the stopwatch. Every 30 seconds check the amount of water displaced in the measuring cylinder, we chose this time because was far enough apart so we did not rush and make errors, and near enough to show the increase in reaction. When 4 minutes has elapsed, or when the reaction begins to stop or slow down, stop the stopwatch. Repeat the experiment with different concentration until you get the data required.
Diagram:
Preliminaries:
In my preliminaries I tested three different sizes of marble chips, large, medium and powder to see which gives the best results because we did not want it to go really quickly or really slowly.
Powdered marble chips
Time in seconds and total volume of water is 50cm3 and the amount of water displaced by the carbon dioxide is in cm3
In the 50:00 concentration, in powder, you could only plot to points because it went to quickly, this is because there is a bigger surface area and so more points to collide with the hydrochloric acid. Also the powder clumps together and is then broken apart, very unreliable.
Small marble chips
Time in seconds and total volume of water is 50cm3 and the amount of water displaced by the carbon dioxide is in cm3
This size of marble chip works better than the powder because it is slow enough to see the increase in reaction and fast enough slowing down.
Big marble chips
Time in seconds and total volume of water is 50cm3 and the amount of water displaced by the carbon dioxide is in cm3
This size of marble chips takes to long so my group decided to use the small because they are quick enough to see the reaction slowing down yet fast enough to see a different in the concentrations. I am going to follow the same method as set out in my plan, but using about 1.45 grams of small marble chips. The experiment we have decided will go on until it begins to slow down however this may take too long so the cut of point is 8 minutes. We are repeating the experiment three times and use the average also we are doing two more ratios of concentration so we are now doing: 10:40, 20:30, 30:20, 40:10 and 50:00 (acid: water).
- Use 1.45 grams of small marble chips
- Ratios 10:40, 20:30, 30:20, 40:10 and 50:00
Results:
Set one
Time in seconds and total volume of water is 50cm3 and the amount of water displaced by the carbon dioxide is in cm3
Set two
Set three
Averages
I have decided not to use the averages because some data in each set will affect the total. These extreme values either pull the data down or up. However the averages do show that the concentration does affect the rate of reaction and that as you increase the concentration you increase the rate of reaction.
Observations:
(Acid: water)
10:40
20:30
30:20
40:10
50:00
Analysis and conclusion:
Graphs
I have done three separate graphs, one for each set of data. After looking at the graphs I can conclude the there is a increase in the rate of reaction as you increase the concentration because the gradient appears to be getting steeper as you increase the concentration (I am going to work out the gradient to ensure that this is correct). The only set of data that is not particularly reliable is the third set, this is because the 40:10 concentration produces less oxygen than the 30:20, so this may affect the average gradient by pulling it down slightly. (Reasons for the anomalies are listed in the evaluation). However from evidence of my graph there is not that much of an increase in rate of reaction between 40:10 and 50:00. This is because the lines of best fit are very close together. After I have calculated the gradient I will be able to give a more informed conclusion on whether the rate of reaction does not greatly increase between 40:10 and 50:00.
Gradients
For each graph and concentration I have worked out the gradient to see whether there is an increase in reaction, this will be evident if there is an increase in gradient as we increase the concentration however I already believe that there is a different because you can visually see it on the computer. I have averaged each concentration form all three graphs so the extreme values may affect it slightly.
Formula for the gradient
Change in y y1-y2
=
Change in x x1-x2
Concentration 10:40
Set 1 points: (4,4) and (2,2)
4-2
= 1cm3/minute
4-2
Average: 1.0cm3/minute
Concentration 20:30
Set 1 points: (4,14) and (2,6)
14-6
= 4cm3/minute
4-2
Average: 5.6cm3/minute
Concentration 30:20
Set 2 points: (4,22) and (2,9)
22-9
= 6.5cm3/minute
4 -2
Set 3 points: (4,22) and (2,9)
22-9
= 6.5cm3/minute
4-2
Set 1 points: (4:47) and (2,15) Set 2 points: (4,70) and (2,39)
47-15 70-39
= 16cm3/minute = 15.5cm3/minute
- 2
Average: 15.8cm3/minute
Concentration 40:10
Set 1 points: (1:12) and (2,35) Set 2 points: (4,62) and (2,24)
35-12 62-24
= 23cm3/minute = 19cm3/minute
- 2
Average: 20.5cm3/minute
Concentration 50:00
Set 1 points: (3:65) and (2,40) Set 2 points: (3,65) and (2,48)
65-40 65-48
= 25cm3/minute = 27cm3/minute
- 3-2
Average: 24.0cm3/minute
Average gradient
10:40 = 1.0cm3/minute
20:30 = 5.6cm3/minute
30:20 = 15.8cm3/minute Steeper gradient
40:10 = 20.5cm3/minute
50:00 = 24.0cm3/minute
I can now conclude that there is an increase of the rate of reaction as you increase the concentration of hydrochloric acid in a solution. This is evident because the highest reaction rate occurred when the concentration was highest and the lower amount of gas was produced when the concentration was weakest and when the number of moles was lowest. From my data I can conclude that the greatest difference is between 20:30 and 30:20 when the gas produced increases by about 10cm3 per minute. The reason for this is that as you increase the molarity you increase the chance that particles will collide with the right velocity to react. The results fulfilled half my prediction however the rate of reaction did not seem to show any signs of declining other than in the 10:40 concentration. However this could be because I did not leave it on for long enough and perhaps to improve the experiment I could have done it for longer. However given time I still believe it would have decrease in speed like evident in the 10:40 concentration. Also according to my results as you double the number of moles you do not double the chance for collisions. However it may double the chance however they may not collide with correct velocity to create a reaction.
Evaluation:
I believe that the sets of experiments went well however there were some anomalous results in set 3 where the rate of reaction was slower in 40:10 than in concentration 30:20. This could be for a number of reasons, there could have been excess gas in the delivery tube in 30:20 that cause the results to be so high because it is higher than the other two sets of data this also pulled up the average gradient. To have solved this I should have used the same delivery tube or “Bubble” tested it to see if there were any holes. Also I did the experiments on separate days, this may have had an effect because the temperature may have been different, this will have effected the results because temperature can effect the rate of reaction. Furthermore even though the mass of the marble chip is the same it does not mean that the surface area is the same perhaps the marble chips in the concentration 30:20 had a bigger surface area than those in 40:10. This affects the rate of reaction because as you increase the surface area you increase the chance of a collision and that in turn increases the rate of reaction.
Another reason could be because of inaccurate reading, to solve this problem in the future I could have measured mass lost, to do this I would put the conical flask on a set of scales and measure the initial weight then the mass every 30 seconds like I did with the displacement. This would work because the gas/product would escape and cause a loss in mass. Another possible method I could have used was the gas syringe in the place of the measuring cylinder however this would have had the same problem with inaccurate reading but it may have prevented gas in the measuring cylinder at the beginning affect the results. However if I did the experiment again I would use the mass difference because it gives a more accurate digital reading and there are no tubes where gas could affect the results.
There are many possible improvements I could make with the experiment I have just done, if I do the experiment again I would use a bigger measuring cylinder so that the experiment can go on for longer and I could see where the rate of reaction begins to slow down. An additional improvement would be to use a smaller mass of marble chip perhaps 0.5g, for the same reason as the bigger cylinder so that I could see where it decreases in speed.
I believe my results fulfil the prediction they prove that as you increase the concentration you also increase the rate of reaction. Despite the anomalous results there is evidence to back up the conclusion. However if I did the experiment I would use the improvements listed above or the better method to ensure that the results are as reliable as they can be.
Abigail Male Chemistry SC1- How concentration affects the rate of reactions 28th