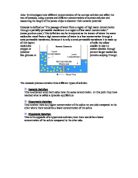
Prediction
I predict that the potato chip placed in the lowest concentration of sucrose will increase in size the most. This is because of my previous research and of the movement of water molecules from a higher concentration to a lower water concentration. I also predict that potato chip placed in the highest concentration of sucrose will be the smallest in size at the end of the experiment this is because the water contained in the chip will leave due to osmosis and in turn make the cell flaccid and be shorter in length. I also predict that there will be a point where the potato will remain at the same length this is because of the equal amount of water particles in the potato and the solution surrounding it
Variables that may affect the experiment
- Concentration of sucrose solution
- Size of potato
- Type of potato
- Time
- Temperature
Concentration
This is the variable that we will be changing; however we must monitor levels of sucrose closely for this to be a fair experiment.
Size of potato
The size of the potato must be consistent to ensure a fair test. For results purpose the size of the potato chip will be 2.5cm. Using Vernier callipers we are able to measure the potato chip accurate to two decimal places. If the chips differed in size it would mean that the larger chip has more cells for osmosis to take place and the experiment would have little credibility and would render results useless.
Type of potato
With a range of potatoes ranging from King Edward to Maire piper it is pivotal that I keep the type of potato the same. This variable is easily controlled by buying the same type of potato. Different potatoes may have different osmotic potentials.
Time
The longer the potato chip has in the
Sucrose solution the longer osmosis has to occur. For this to be a fair experiment the potato chips should be left in for the same period of time. We will monitor the time taken by using a timer and observing the taken that has passed at all times
Temperature
The temperature is difficult to control because of the size of the room we are conducting the experiment in. If the temperature was to rise dramatically the particles would have more kinetic energy and osmosis would take place at a faster rate. A thermometer could be placed in the test tubes to monitor temperatures.
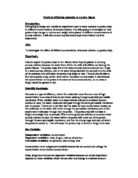
Preliminary Investigation
10 minutes after placing the chip I measured them, from these results I can see that I will have to leave the chips in for a longer period of time if I wish to get sufficient below is the same experiment but for 30 Minutes.
This pilot I changed only the time I left the chips in for. Instead of leaving the chips in for 10 I left them in for 30 minutes. I have decided that I will leave the chips in for 30 minutes to allow for sufficient water movement and to gain a more reliable set of results
Safety Precautions
- Make sure all hair is tied back
- Maintain a clean and tidy working environment
- Wash hands before and after experiment
- Stand at all times
Equipment list
Potato- Same size and same shape
Sucrose solution
5 Test tubes
Test tube rack
2 25cm measuring cylinder
Scalpel
Timer
Cork borer
Vernier Callipers
Distilled water
Method
- Insure Equipment is all present and correct
- Cut 15 potato chips using a scalpel assuring that they are all the same length, size and weight (2.63cm)
- With a measuring cylinder measure out Sucrose solutions needed
- Place three potatoes in each test tube with the varying solutions and start timer
- After every 5mins for 30mins take out the chips and measure with Vernier Callipers
- Record results in table
Fair Test
For the results to be credible this experiment must be a fair test. I must only change one variable (concentration). All other possible variables must stay the same and be consistent. Below is a list of all other variables which will not change
- Shape of potato chip
- Size of potato chip
- Type of potato chip
- Weight of potato chip
- Same accuracy used (2.d.p)
The results I will be recording are the different lengths of potato chips after osmosis has taken place, comparing them to the original size of 2.60cm. There will be 5 different types of concentration. After 30 minutes I will record the results
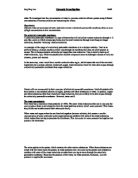
Analysis
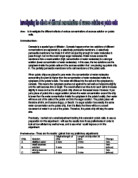
From the graph we can see that the results closely matched the predictions with the varying rates of osmosis corresponding with the different concentrations of sucrose we can also see that the potato chip decreased with 20%, 25% and 30% solutions.
The results were on the whole what was expected with only one anomalous result. The 25ml sucrose results were extremely clear showing what was expected with the passage of water travelling from the potato to the sucrose where there is a lower concentration. The 20 ml sucrose and 5ml results were not as expected with the results over the three experiments varying with no noticeable trend errors in measuring could have been to blame. The 15ml sucrose and 10ml water results produced one abnormal result (highlighted in green) again errors in measuring could have been to blame however with external variables such as temperature not under our control this could have produced the result. From the results we can see that our predictions were correct and the potato chip that was put in the lowest concentration of sucrose had the largest increase in size this was because of the concentration of water being higher in the test tube with the net movement being from the solution in to the potato chip. This in turn makes the cells in chip to become turgid.
I also predicted that there will be a point on the graph where the potato chip stays the same due to the concentrations being equal both in the chip and in the sucrose solution. When this occurs is it called the isotonic point. We did not get an exact isotonic point because of limitations.
The chip that was placed in the solution containing the highest solution of sucrose was the smallest in size. This was because of the movement of water molecules. The water concentration was higher in the potato chip than the solution thus causing the net movement to be from the potato chip to the solution. This caused the chip to become flaccid and to shrink.
Evaluation
On the whole the experiment was a success it demonstrated the theory of osmosis. However we did record a small number of anomalous results. Repeating the experiment more times would have produced more accurate results but due to time constraints this was not possible.
Limitations and Improvements
There are a Varity of reasons for the anomalous results one of which being that not all of the chips were 2.60cm they could have in theory been out by 0.01. This could have been improved by measuring the chips to a greater degree of accuracy. In each test tube there were three potato chips this could have affected the results because the concentration of glucose would change. Putting one chip in each test tube may have improved reliability.
Human error could be at fault as mistakes may have been made when using the Vernier callipers. Firstly when measuring the initial size of the chip then measuring the final size of the potato once osmosis had taken place. Also the solutions that were being used were made up using water and pure sucrose when constructing the mixture it may not have been entirely accurate leading to unreliable results.
Variables like temperature were not able to be controlled; some test tubes may have been left in sunlight whereas others may have been left in shade. Instead of measuring the size of the potato chip nest time we could record the mass of the chip this would cut down on human error.
To further the investigation we could experiment with different types of potato recording which ones have the most net movement of water. Furthermore we could more concentration intervals doing this would allow for further analysis of results