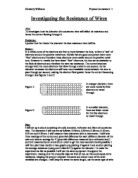
electrons to travel
through.
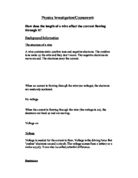
In a smaller diameter,
Figure 2: there are fewer routes
for the free electrons
to travel through.
Plan:
I will set up a circuit consisting of a cell, ammeter, voltmeter and 50cm of constantan wire. The diameters I will use are as follows. 0.56mm, 0.43mm, 0.38mm, 0.32mm, 0.27mm and 0.20mm. I will measure these diameters with a micrometer. I will take three readings of the current and potential difference for each different diameter of the wire and take an average for V (potential difference measured by a voltmeter) and I (current measured by an ammeter) in order to get the most accurate results possible. I will then plot these results in two graphs one plotting V against I and another plotting the average resistance (using ohm’s law R=V/I) against the diameter. To make the experiment as fair as possible I will use the same equipment throughout the experiment, making sure the crocodile clips are free of rust, as this could cause extra resistance, keeping the amount of power the same and ensure none of the other variables are changed. I will keep the wires the same length, use the same type of wire and make sure the wires are always room temperature. To do this I will make sure the wires have cooled down from their last use. I will achieve this by leaving 2 minutes between each experiment so the wire can cool down. I will use a micrometer will be used to measure the diameter of the wires.
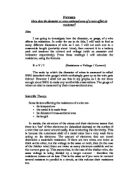
Diagram:
50cm Constantan wire.
A
V
Crocodile Clips
Results table and graphs:
See graph and result table pages.
Conclusion and Analysis:
My results show that as the diameter is increased the potential difference (V) decreases, the current (I) increases and the resistance (V/I) decreases, showing that when the diameter is increased the resistance is lowered and therefore the current is increased. I can see this from my results table, looking at the averages. On my graph I plotted the diameter against the resistance the points plotted produce a curve of best fit, showing that the diameter could be indirectly proportional to the resistance of the wire. To test this I would have to plot a graph plotting the average resistance against 1/d when d is the diameter of the wire. If the results were indirectly proportional a straight line through the origin should be achieved. These results are the same as my prediction that the thicker the diameter, the less resistance there will be. This is all due to the fact that as the diameter of the constantan wire is increased; the “free” electrons within the metal have more routes between the ions in which to flow and therefore there is a greater electron flow between the ions producing a stronger current. This is also due to the ions not producing as much opposition to the “free” electrons as there are more routes between the ions for them to pass, unlike a thinner wire where there are fewer routes so the ions are more obstructive.
Evaluation:
My plan worked very well as I did not have to change any of my original plans. Most of my results were accurate although one of them was anomalous. This was the reading for V / I on the 0.43mm wire on my graph. It did not fit the curve of best fit. This inaccuracy could have been caused by human error, by which I misread the voltmeter and/or the ammeter or the connections in the circuit were faulty. I also had an anomalous result in my results table which did not fit the pattern and is not anywhere near the previous experiments. I repeated this reading and found the true result. After performing the experiment I feel diameter was not a good variable to choose, as the wire is three dimensional, with an uneven range which was out of my control. Due to the wire being 3 dimensional, the free electrons flow through all the routes in the area of the wire, so a relationship between the resistance and the area of the wire is more likely than a relationship between the diameter and the resistance.
To extend my investigation I could calculate areas of the cross section of each wire and plot a graph to find out R x I/A.