The second factor of the length of material would suggest the answer to my aim is that the resistance will increase with length. However, it is my job to form a prediction and then test my prediction.
Ohm’s law- is the physical principle stating that the electric current flowing through a metallic conductor is directly proportional to the potential difference between its ends, as long as the temperature stays the same.
V= IR or I= V/R
Prediction- from the scientific know ledge I have acquired I predict that:
“The longer the length of the wire, the greater the resistance, thus reducing the current flowing through the wire and vice versa for a smaller length of wire.”
I will now perform a test to help to either prove or disprove my prediction.
Plan- Equipment- Ammeter, voltmeter, variable resistor, test wire, metre rule, leads, crocodile clips and a power pack.
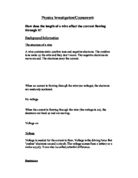
Circuit Diagram-
Test wire
Method- For the test I shall set out the equipment as above. I will keep the same wire (so there is no difference in the thickness which could affect the resistance), I will also keep the circuit, try to keep the temperature and voltage the same so that the test is a fair test.
To allow me to investigate my prediction I shall measure the length of the wire and the amps (current). This means I shall place the crocodile clips at certain length’s along then wire and measure, using the ammeter, the current flowing through, this will allow me to see, by any differences occurring, whether the length of wire does in fact affect the current flowing through it. I will estimate a place to put the variable resistors wire, where I think appropriate.
Here are the lengths I used on the wire to see how much current was flowing through:
0cm, 5cm, 15cm, 25cm, 35cm, 45cm, 55cm, 65cm, 75cm, 85cm, 95cm.
Trial run- I will perform a trial to see if any faults lie in my circuit, method etc and also to see whether the chosen lengths or chosen resistance on variable resistor provides data that will be good to analyse i.e. enough range so as too prove difference. Here are the results from my trial run.
Results-
The results of the amount of current proved to not show enough range between the results and so would not give an accurate and reliable answer, after analysis, to either prove or disprove the prediction. It was therefore evident that I would have to change the resistance of the variable resistor to create more resistance to hopefully give a better range to the current results. This would make the data easier to analysis.
The same test was repeated three times so that an average of the three tests could be calculated creating fairer and more reliable results that would, hopefully, give constant results.
Results of 3 tests
TEST 1
TEST 2
TEST 3
The current ranges were 0.6. This showed the resistance was now at a good setting because a range of 0.6 meant the data could be analysed better.
Here is a table showing the averages of the three tests:
To represent this information is a graph overleaf.
The graph clearly shows that as the length of the wire increases the amount of current flowing through the wire decreases. This suggests that resistance does increase with the length of the wire, explaining the decrease in current in the graph. This would prove my prediction correct. However, the line of the plot graph is not straight although from re-arranging Ohm’s Law it would suggest the current is proportional to resistance:
I R
And so we would expect a straight line. To try to gain a straight line we can re-arrange Ohm’s Law-
Step 1
Ohm’s Law- V=IR
So V=I
R
We then replace V (Voltage) with a constant of 1. So-
1=I or 1 I
R R
We know that:
L=Length L R
Step 2
We turn this into a fraction:
1 1
L R
Step 3
We can then bring the current (I) into the formula as we know that 1 I. So:
L R
1 1 I so, 1 I
L R L
y x
The equation for a straight line is y=mx + c, by substituting length for y and I for x we will gain a straight line (in theory).
Step 4
Finally to make a better scale for the graph we change the formula to:
- I
L
This formula will, in theory, provide a straight line in the graph. Here is a table showing the results in the from of the new formula;
To represent this information is a graph overleaf
However, I was wrong, as the formula does not produce a straight-line graph. In stead the line is curved. Nevertheless, this is probably due to small human errors or things beyond my control such as heat in the wire. My graph still shows that as the length of wire increases the current through it decreases so:
Conclusion- from the results I received from the tests I performed, and the graphs I conclude that my prediction is correct and the longer the wire, the greater the resistance, thus reducing the current flowing through the wire. This is because the graphs show that there is a positive correlation between the length and the current going through a wire.
Analysis
Although I have formed a conclusion, of my prediction being correct, there are certain factors that could prove my results not entirely correct. For long wires my prediction was good but for short wires the results were not as conclusive as predicted and this was the reason why my graphs were not straight. This reason for the short wire lengths providing inclusive results was due to them getting hot and so energy is lost to the surroundings in the form of heat energy. This happens because short wires have small resistance and large currents, which means atoms of the wire, are hit more by electrons, causing them to vibrate faster. The atoms get in the way of the electrons so pick even more vibrational energy meaning more atoms vibrate even more producing releasing more heat energy and so the temperature goes up. Ohm’s Law does not apply if the temperature changes and so these would explain the curved graphs.
The graph doesn’t carry on upwards due to heat in the wire.
Evaluation
I feel that I have performed this investigation to my best capability and I believe that I have made a fair and valid conclusion.
However, there were some odd results shown in my graphs and tables, although all the currents has a range of 6 so the results were not too obscure which means I still believe that my results are valid. These were probably due human error on my behalf or matters beyond my control.
I believe that my experiment was suitable as it clearly showed a good conclusion, it was not hard to follow and formed a good basis for my investigation. Yet there are ways in which my experiment could be improved to overcome any errors that occurred such as; I could use a baby thermometer to check the heat of the wire to see if it was hot so that I could see where to end the experiment. I would end the experiment where heat was being produced, as at this time Ohm’s Law would mean that the experiment wasn’t working anymore and the results were becoming invalid. I could also repeat the experiment further so as to gain a mean from more results meaning fewer occurrences of errors in the findings. Also, if I was to use a higher resistance on the variable resistor it would mean less current and so less heat would be produced meaning more consistent and valid results
To expand on this investigation I could experiment with different lengths of wire, wires of different materials and different temperatures as we used room temperature