Diagram;
Results;
Conclusion; The higher the temperature, the higher the bounce. As the temperature of the ball increased, the rubber became more pliable and it stretched more when it hit the surface of the desk. Because rubber is an elastic material, it returned to its original shape. This provided a force with which to bounce away from the surface with. As the temperature increased, the rubber was more pliable, had further to travel to get back to its original shape and therefore had more force with which to bounce. This meant that it bounced higher.
I am going to investigate how the temperature of the ball affects how high it bounces.
Prediction; I think that if I increase the temperature of the ball then the bounce will increase also. This is because at hotter temperatures, rubber becomes more pliable and stretches more when it hits the surface. This means that it has further to travel to get back to its original shape and bounces away from the bench with a greater force, meaning that it reaches a greater height.
Plan; I am going to repeat the experiment I did for my preliminary work, but with some alterations.
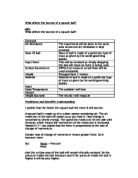
Things to keep the same;
- I will always use the same ball, squash ball A. This will prevent any variance in the surface or weight of the ball.
- As I am working in a pair with Amy Stringer, I will make sure that we don’t switch jobs. This will eliminate the possibility of us dropping the ball differently or having different reaction times and therefore getting varying degrees of accuracy.
- I will always drop the ball from a height of 1m, with no added pressure, so as to make the test fair.
- Each time I drop the ball it will be on the same surface, the wooden desk because the surface is another factor, which might affect how a ball bounces.
- We decided to increase the number of readings taken at each temperature to ten, this will increase the accuracy of our results. This also means that our average value will be more reliable. We also settled it that we would run a test bounce to define the specific area of the ruler, where we expected the ball to bounce. This considerably helped the accuracy of our results. This is the method that we tried and tested for our preliminary work.
- As in our preliminary work, we used water or ice, in beakers with thermometers to achieve the required temperatures. After suggesting many other methods of doing this, we have decided that this is the best, easiest and most reliable.
- Basically we will set up the equipment as in our preliminary work. We found when doing that experiment, that it was easier to hold the ruler upright with a stand and clamp. We will continue this in our main investigation.
- We will always take measurements from the bottom of the ball.
Things to change;
-
So that we get a steady range of results we have decided that a 10° C interval will be appropriate between the different temperatures. This applies for both positive and negative figures.
- As our aim is to only investigate one factor that affects how a ball bounces, the temperature must be the only thing that changes.
Equipment required; beakers, thermometers, meter rule, clamp and stand, squash ball A, the surface of a desk, kettle, tongs, supply of ice.
Diagram;
Method; The majority of our experiment went as described in the plan. We discovered that once you got above 60°C, the ball was too hot to touch. The tongs were required to take the ball out of the water and to drop the ball, but still no force was added as we dropped the ball. We also found out that although water boils at 100° C, by the time you had poured it out of the kettle, taken the temperature and put the ball in, it had dropped to, on average 80° C. We also found that although you could get the ball to a temperature of 0° C with ice, it wouldn’t go below that. We knew that impure water boils at a higher temperature and freezes at a lower one. Therefore we added Sodium Chloride (salt) to our ice to get the readings for -10° C. In the classroom we could not go below this, even with the ‘salty ice’. We solved the problem of the water no longer being hot enough once it was out of the kettle by heating it in a beaker over a Bunsen burner. We also added salt to this to increase the temperature.
Results;
Analysis of evidence; Graph 2 shows results for every trial at each temperature. Although the range of results varies, it still shows us a very positive trend. The line of best fit accentuates this. From the graph, you can see that as the temperature increases, so does the height the ball bounced. This reflects my prediction. They appear to be approximately proportional to each other. If this is correct a formula would be;
Temperature ∝ bounce height.
When you look at graph 1, of the averages from each temperature bracket, the line does not appear to be straight. It looks like it has a slight ‘C’ curve at the bottom and an ‘S’ shaped curve at the top
Conclusion; The higher the temperature of the ball, the higher it bounces. This is reflected in both my prediction earlier and my graphs. When researching a bouncing ball I came across the relationship between the ball’s total energy and the height it reached when bouncing. It said that there would be the same percentage drop in one as in the other. This is another relationship, which relies on two things being proportional to each other. Because of the similarities, I must conclude that there is a very strong likelihood that the relationship I noticed in my graph is reliable. Despite this, it would require further testing before anything could be proven. Using our preliminary work as a guide, we set about planning an experiment, which would provide us with a relationship between the temperature of the ball and its bounce height, The ball bounced higher when it was hotter because the heat made the rubber that the ball is made of more pliable. It therefore compressed more with the force of hitting the hard surface. Because it had compressed more, it had further to travel to return to its original shape (rubber is an elastic material).
Evaluation; in my graph, I had a few anomalous results. This is probably because some of our readings weren’t accurate. If I repeated this experiment, I would concentrate on finding a more accurate way of measuring the bounce. Even though we did a practice run before taking down readings, this obviously wasn’t accurate enough. A better way of heating the ball would have been to heat the air around it and keep it at a constant temperature. This would not have allowed it to cool down, whereas the method we used, despite trying our hardest will probably have allowed the ball temperature to drop. Another thing that must be considered when looking at the accuracy of my results is the way the ball bounced. It did not always bounce straight. When the ball bounced at an angle, the height would have been reduced. We should have taken this into account.
On graph 1, it is the value for 40 ° C which is the most anomalous, but the average of the readings for 90 ° C is also a bit ‘funny’. This compares to graph 2, where the number range for 80° C is the furthest away from the line of best fit. The line also skims just outside the results for 90° C and 40° C. These are both interesting because they are anomalous on both the graphs, but this should, in theory be the case for all the anomalous results because they are based on the same figures. We only had to make a few adjustments to our plan, which are mentioned in the method. When writing the plan, I relied heavily on our preliminary work using it as a guide for the best way to carry out my experiment. If I were to change any part of my method, it would be the way we collected our results because it wasn’t accurate or reliable enough. Another way of measuring the bounce would be to use a Polaroid camera or for even better results, a video camera. If this worked, it would produce images of the peak of the ball’s bounce and we would be able to measure it exactly.
Preliminary work:
Results: