I predict that as the concentration increases, the rate of reaction will also increase. The collision theory states that when the number of particles in an area doubles, the number of collisions in that area should also double. Twice the number of collisions means twice the number of particles in excess of activation energy, thus doubling the rate of reaction. This means that for this experiment, when I double the concentration of the sodium thiosulphate, the rate of reaction should double, because more collisions means more energy, and twice the number of collisions means twice the amount of energy. Due to this, I would expect a graph of my results to show a straight line. It should also go through the point (0,0), because when there is no sodium thiosulphate there will be no reaction.
I predict that as the temperature rises, the rate of reaction will increase. This is because heating particles gives them more kinetic energy, and so they move faster. This has two effects in fluids:
- There are more collisions.
- The collisions are more energetic.
The ten-degree rule states that when the temperature rises by 10oC, the rate of reaction will double. Due to this, I would expect a graph of results for this experiment to be a curve.
Method
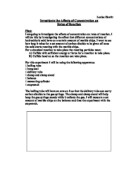
I will set up the apparatus as shown below:
I will mix the 10ml of the acid and 30ml of the sodium thiosulphate in the conical flask and start the timer. I will give the flask one swirl and then leave it, until the reaction has reached a certain point, and I stop the timer. This point is, as described previously, when the cross on the mat below the conical flask is no longer visible from above.
During the experiment to investigate how different concentrations affect the rate of reaction, I will repeat the experiment with different concentrations of thiosulphate, taking seven different readings between 10g/dm³ and 50g/dm³. All my readings will be repeated again, and then, if the two readings are more than 20% apart, I will take a third reading. I will then take the average of whichever two are less than 20% apart. This will make it more of a fair test. All of the readings will be taken at room temperature, and I will take the temperature before and after every reading to make sure that it does not change.
During the experiment to investigate how different temperatures affect the rate of reaction, I will take seven readings between room temperature and 90oC. I will heat the thiosulphate to just above the temperature I wish to take a reading at, then take it away from the Bunsen burner. I then pour it into the conical flask, and add the acid, starting the stopwatch. I take the temperature and then I continue the experiment as described previously, stopping the timer when the cross on the mat is no longer visible. I will try to take repeat readings at the same temperature, but due to my equipment not being very accurate, the repeats may not be at the same temperature. To make it a fair test, I will always use the same concentration of thiosulphate, 25g/dm³.
For safety I will not sit down at the bench when there is liquid being heated, in case it is spilled. I will also always be wearing goggles to prevent any acid getting into my eyes.
I am measuring the rate of reaction. However, I cannot measure it directly. To find the rate I will need to calculate it by one divided by the time.
Results
Below is a list of results for the concentration experiment:
I kept the temperature at room temperature.
Below is a list of results for the temperature experiment:
I kept the concentration at 25g/dm³.
For this experiment, I am measuring rates of reaction, the speed at which the reaction takes place. However it is not possible to measure the rate directly; I must measure the time, and then convert it into rate. To do this, I use the formula:
Rate = 1 / Time
However, this formula gives you a very small number, which is had to plot a graph of. Due to this, in my results I multiply the rate by 1000.
Analysis
By looking at my results I can see that in the concentration experiment, as the concentration of sodium thiosulphate went up, the rate of reaction went up. I can see by looking at my results for the temperature experiment, that as the temperature went up, the rate of reaction went up.
By looking at my graph of results for the concentration experiment, I can see that the rate increased at a steady rate, by the shape of the straight best-fit line that is formed by the points. The best-fit line agreed with my prediction, that it should be a straight line and go through (0,0). This is because when the concentration doubles, the amount of collisions will also double, meaning that twice the number of particles will have energy in excess of activation energy. It goes through (0,0) because when there is no sodium thiosulphate there is no reaction. There was one anomalous result in this experiment; the reading for the concentration of 15g/dm³. This was slightly away from the line of best fit because I took this reading on a different occasion and the temperature was slightly (approx. 1oC) higher than the first time I took readings. I have found that every 10g/dm³ extra of sodium thiosulphate, the rate of reaction goes up by approximately 0.005s-1. Some points on my best fit line that show this are when the concentration is 10g/dm³, the rate is 0.005s-1, and when the concentration is at 20g/dm³, the rate of reaction is just above 0.01s-1. This shows that my prediction was correct, that when the concentration is doubled, that rate of reaction will also double. I think for this part my results very much support my prediction.
By looking at the graph of results for the temperature experiment, I can see that as the temperature increased, the rate of reaction increased, but as the temperature continued to increase the rate at which the rate of reaction was increasing increased, forming an upwards curve. This shape of curve agrees with my prediction, although the steepness does not. I predicted, using the 10-degree rule, that when the temperature rose by 10oC, the rate of reaction would double. However, looking at my graph, this does not happen. Take the points on the best-fit line at 20oC and 30oC. At 20oC, the rate of reaction is 0.019s-1, but at 30oC, the rate is
0.035s-1. Although these readings are not too far off where I expected, this error is amplified at higher readings, for example, at 65oC the rate is 0.115s-1, but at 75oC, the rate is 0.132s-1. This is a very long way from being the first result doubled. These results do not support my conclusion.
Evaluation
I think my experiment to investigate how different concentrations of a reactant change the rate of reaction went very well. The graph of results for this experiment formed an almost perfect straight line as I expected, with only one result looking at all out of place, due to being taken on a different occasion. The procedure worked very well. However, if my apparatus had been more accurate, I could have obtained an even better line. For example, the measuring cylinders only measured to the nearest ml. This is quite accurate, but gives an error margin of 1ml, which is quite a lot when you are using only 10ml of acid in the experiment. Also, it was sometimes difficult to decide when the cross under the conical flask had disappeared. A way in which this problem could be solved would be to have a light sensor under the flask, connected to the timer. When the light dropped below a certain level, it could stop the timer for you, decreasing the risk of human error. However, I would have to make sure that the light stayed at the same level for each result, with no additional lights being turned on.
However, the temperature experiment was nowhere near as accurate. None of the points seemed to be anomalous, but they did not follow the pattern that I was expecting. I found it difficult to get the sodium thiosulphate to reach the correct temperature, due to the thermometer taking time to change what it read. This could be helped by having a more responsive thermometer, but ideally, it would be best to have more accurate heating equipment, such as a water bath, which makes it much easier to regulate the temperature. Also, when the sodium thiosulphate had reached the correct temperature, it was taken away from the heat, so the temperature could drop while the reaction took place. The final point about the temperature is that only one of the two reactants was heated, so when the second was added, the temperature dropped a little, but I had no way to predict how much this amount would be. This was due to limits on the apparatus available.
I think the evidence for the concentration experiment was reliable enough to support the conclusion. I had a fairly wide range of results, which were in an obvious to spot pattern. When I repeated the readings, the difference was less than 20%, which was the amount of difference I said I would need to decide to repeat the reading a third time. I don’t feel I would like to repeat any results again using the apparatus I had, because I feel I got almost the best results I could have in the circumstances.
I don’t think that the evidence I obtained for the temperature experiment was reliable enough to support the conclusion. I found that the results were lower than I expected. For example, when I was expecting a double in the rate, due to the temperature rising 10oC, I only got a rise in rate of below 50% (see example in analysis). The cause of this is as I explained above.
If I were to do further work, I would study the effect of a catalyst on the rate of reaction, looking at how different amount of a catalyst present in the reaction changed the rate. I would keep the amounts of the other reactants (sodium thiosulphate and hydrochloric acid) the same. Another thing I could investigate would be rates of reaction a solid and a liquid, although I would need an accurate way to measure surface area. I could use one solid, and see how its surface area affected the rate of reaction.