In the international system of units, the unit of force is the Newton, which is the force that imparts to an object with a mass of 1 kg an acceleration of 1 m/sec2.
Acceleration tells you how quickly an object increases in speed. You can work out acceleration like this;
Acceleration= change in velocity
Time taken
a = (v-u) (v = final velocity)
t (u = initial velocity)
(t = time taken)
Prediction/ Hypothesis:
I think that as the mass on the end of the string increases the time taken for the pulley to reach the end of its run will decrease. I think because of this the acceleration will be greater as will the average speed. Therefore as the force applied is increased the rate of acceleration will be greater.
Method:
- Firstly the apparatus was collected from the side bench.
- Then the power pack was plugged into the mains electricity socket.
- Then the ticker timer was connected to the power pack using wires (make sure you use the AC sockets)
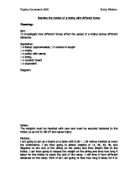
- Then a pulley was connected to the end of a table. (Fig 1)
Pulley
Fig 1
- Then the string was measured to a specific length of one meter (make sure you do not throw this away as you need to use the same string to make this experiment a fair test).
- Then one end of the string was tied to the trolley and the other end was rested on the pulley and made into a loop and 0.5N was hung on the end (don’t let the weight go yet).
- Then the ticker timer tape was fed through the ticker timer and sellotaped to the trolley
- Then simultaneously the person holding the weight let go and the person who fed the tape through the ticker timer switches on the ticker timer via the power pack.
- Then as the trolley reached the end of its one meter run the ticker timer was stopped and the results were recorded.
10. Repeat from step 6 onwards using the weights 1N, 1.5N,
2N, 2.5N, 3N.
(Note. Keep all other variables constant to insure a fair test.)
Results:
Each result is acceleration and was worked out in the following way:
Acceleration= change in velocity
Time taken
a = (v-u) (v = final velocity)
t (u = initial velocity)
(t = time taken)
(d = distance)
To calculate v
You measure the distance between the last two dots on the ticker timer tape in mm then you convert the measurement from mm to cm to m. Then you divide the measurement in m by the time taken.
To calculate u
U = the velocity at the beginning of the experiment which in this case is 0 as the trolley is not moving.
To calculate t
The time = the number of dots times 0.02.
For example using a force of 0.5N, you have to find out count the number of dots. In this case it is 111.then you have to find out the distance between the last two dots in meters. To do this you have to measure the gap in millimetres then convert that into centimetres then into meters. In this case it is 0.013m. Then you divide the gap (d)(in meters) by 0.02 (t) to give you v. then you take away u from v, which is 0.65-0. u is 0 because the initial velocity is 0. Then you divide the v-u sum by (t), which in this sum will be 0.65 divided by 111x0.02 to give you the final result. Your working should look like this:
0.5N = 111 dots
13mm
1.3cm
0.013 (d) = 0.65m/s
- t
a = v-u = 0.65 - 0 = 1.171171171 m/s²
t 111x0.02
Conclusion:
The reason for these changes is because the acceleration will be quicker for the trolley with more weight on it. I think this as because there is more weight acting on the trolley, consequently the gravitational force acting on it will be greater therefore it will pull the weight on the end of the string faster towards the ground resulting in a faster speed/acceleration of the trolley. I also think that some of the surrounding factors affected the results (e.g. friction of the desk which was the force acting against the acceleration).
The trend of my graph I have already explained, in that firstly the acceleration increases steadily until it basically levels out then it increases sharply.
The graph does support my original prediction, which was, as the mass on the end of the string increases the time taken for the pulley to reach the end of its run will decrease. I think because of this the acceleration will be greater as will the average speed.
Evaluation:
On the whole, I think that this investigation went quite well and I believe I carried it out to the best of my abilities in the conditions provided. My range of 6 weights was adequate to plot a graph, which supports my prediction, giving enough evidence to support a firm conclusion. The one point, which did not follow the trend, was 2.5N. At the weight of 2N to 2.5N there was a drastic decrease in the acceleration. I believe this is an anomalous result. I think this because as the graph I plotted is using the average of three results for that specific weight, so one of those readings must have been faulty to make the graph look this way (I have pin pointed the anomalous result and it is 1.22m/s²). Other that this result my table and graph, both together, show that the majority of the readings I got were fairly consistent, showing that the tests were carried out accurately. From the graph you can see that as the force (in Newtons) increases so does the average result of acceleration (in m/s²). At the weight of 0.5N the rate of acceleration is 0.14m/s². This increases steadily past 1N (0.78m/s²) to 1.5N, which is 1.13m/s². Then at 2N the acceleration decreases rapidly until it gets to 2.5N when it increases rapidly to 3N (2.22m/s²).
Possible improvements:
- Using a broader range of weights to get more readings.
- Doing the experiment on the same weight 6 times instead of 3 to get a more accurate average result.
- Use a new desk and not one that has grooves in it so it is a smoother run.
Possible extensions
- Investigate other variables, like friction (maybe use laminated or greased wood) and see weather this has an effect on the rate of acceleration.
-
Further research into Newton’s 2nd law to explain my results in more depth (if I knew the weight of the trolley then I could have used the theory of Newton’s second law, which states, that the acceleration an object experiences multiplied by the mass of the object is equal to the net force acting on an object). For example I could alter the mass of the trolley (by adding weights or using trolleys made of different densities of wood or different sizes of trolley) to test that if a given force acts on two objects of different mass the object with the larger mass will have a lower acceleration.