All these factors i.e. transpiration and photosynthesis, come together to confirm my hypothesis.
To support my hypothesis further, I did a pilot study in a meadow in which I studied the population of certain plant species in areas of different light intensities. I learned that different plants need different environmental factors to grow well. The leaves in the shade were larger than those in the open field.
Expected Results:
Variables: The independent variable in my investigation is the light intensity in the area we are investigating. The other independent variables in the experiment have to be kept constant. If they are not kept constant, then it will not be a fair investigation. The independent variables I am keeping the same in this investigation are:
- Temperature – change in temperature might affect the rate of transpiration.
- Humidity of the field: – this will also affect the rate of transpiration as it will determine the concentration gradient during osmosis from the stomata.
- Wind speed – this will affect the humidity of an area.
- Moisture level – this is an important factor in photosynthesis. If there is a variation in the moisture levels then the level of transpiration will vary, making the investigation unfair.
- Amount of human and animal activities - this will always have an effect on the environment and should be prevented as much as possible.
The dependent variable in this investigation is the change in the leaf surface area.
Apparatus List:
- A small quadrat 25cm x 25cm
- Papers – lined and graph paper
- Humidity and Temperature meter
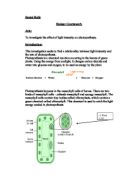
Skill area O: Obtaining evidence
Procedure:
- Get together all the apparatus listed above and pick out the site for your experiment. Prepare a table to record the data collected.
- Look around and gauge which areas are shaded and in full light.
- Throw the quadrat somewhere as randomly as possible towards a shaded area. If there are no plantain leaves in the quadrat, continue to throw it until you get some.
- When you have found a good plantain leaf sample, measure the light intensity, humidity and temperature over the quadrat.
- Take a leaf sample from the quadrat and trace it unto some graph paper. Also record the data collected in step 4 on your results table.
- Repeat steps 3 – 5 in different light intensities i.e. the shade, full light and moderately lit areas.
- Calculate the surface areas of the leaves using the squares on the graph paper. You will have to estimate the surface area and round them to the nearest unit. (1.s.f.).
- Record all your data into the table you previously prepared.
Precautions:
- Make sure you stand clear of the path of the quadrat being thrown. Avoid throwing it to close to the river too.
- When using the sunlight meter, make sure there are no objects obstructing the reading i.e. stand back from the meter.
- To make the test fair, throwing the quadrat should be a completely random process. This can be achieved by closing ones eyes when throwing the quadrat, or to spin around in a circle to confuse oneself of bearings or position.
- To also make the test fair, make sure the same person carries out each measurement i.e. the same person measures the light intensity as their opinion will always be the same.
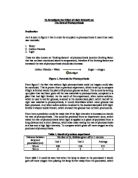
Table:
Graph:
Skill area A: Analysing evidence and drawing conclusions
On my graph I can see a definite pattern. In each of the 3 columns, showing the locations of the leaf samples, the points on the scatter graph all moved down in descending order as the light intensity increased. The points in the first column, ‘Under the tree’; rose to the highest point i.e. highest surface area which was 45 cm2. The beginning of each ‘locational’ column always has the highest surface area point. This suggests that the specified areas will be overlapping each other; they are not clean cut at all.
The pattern on my graph fits my hypothesis exactly. It shows that as the light intensity increases, the size of the leaves decreases. The temperature on the day we did our experiment was not very high, but I could still see the clear difference between the leaf sizes. Transpiration was not encouraged by the low temperature, and also the humidity was very high which would have reduced the osmosis gradient and slowed down transpiration.
Skill area E: Evaluation
I think my investigation was not as great as I would have liked. I admit that my lack of enthusiasm at the beginning might have contributed to it, but also because the working conditions we had were not great. As you can see from the table of results, it was a very humid environment, it was cold and cloudy; all these were not exactly the right conditions to get good results. However, we did get adequate results that substantiated my hypothesis.
My investigation could have been improved in many ways, most of all if we had the optimal weather conditions we need. To have made it a fair test, and made sure all the other independent variables remained constant; I could have used a controlled environment like a greenhouse. With a larger area to investigate with fuller trees and more working time; I could have collected more samples. I would have used this to make the graph my informative and specific. Also, testing other plant species other than the plantain would have been useful e.g. ribwort, dandelions.
To further my experiment I actually investigated another plant species growing with the plantain leaves, dandelions. I carried out the method stated above to collect my dandelion samples and recorded my results in the table below.
This table and graph also confirm that my initial hypothesis was correct.