Apparatus:
A 100 cubic centimetre measuring tube, test tube, 4 cubic centimetres hydrogen peroxide, 2 cubic centimetres pH7 buffer, 2 cubic centimetres catalyse (in the form of potato), 30°C, 40°C, 50°C, 60°C and 70°C Water Baths, ice, three 5 cubic centimetre syringes, and a thermometer.
Method:
The following measurements were used in a previous trial experiment to see whether they were effective. Measure 2 cubic centimetres catalyse (potato) into the 100 cubic centimetre measuring tube. Measure 2 cubic centimetres pH7 buffer and 4 cubic centimetres hydrogen peroxide into the test tube. Place the test tube containing the hydrogen peroxide and pH 7 buffer into the 30°C water bath. Check with the thermometer to see when the hydrogen peroxide and pH 7 buffer have reached 30°C. When this has happened, add the hydrogen peroxide and buffer into the 100 cubic centimetre measuring tube. This will produce froth. Wait for a period of 60 seconds, then measure and make a note of the amount of froth produced.
Repeat the experiment with temperatures of 10°C, 40°C, 50°C, 60°C, 70°C and at room temperature. To achieve 10°C place the test tube containing the hydrogen peroxide and buffer into ice until it reaches the temperature 10°C. Each experiment will be repeated three times for reliable results. I will place my results in a table, and then draw a graph showing my results. I will take care to be accurate in my measurements.
Fair Testing:
To keep this experiment a fair test, in each experiment the same amount of hydrogen peroxide, pH 7 buffer and catalyse will be used. The pH will remain the same in each experiment and the equipment will remain the same. The only variable will be the temperature of the hydrogen peroxide and the pH7 buffer. The pH must remain the same in each experiment as pH also affects the activity of the enzyme catalyse. I have chosen to use a pH 7 buffer as this is the optimum pH most enzymes work at.
Safety:
To ensure that the experiment is safe overalls will be worn to protect clothing and skin from spillages and goggles will be worn to protect the eyes. As the hydrogen peroxide is hazardous, it will be kept out of contact with skin and eyes.
Observation
Results:
The experiment was carried out as described in the method.
The results that are highlighted grey are considered anomalies, so have been discounted from the average.
Analysis
Conclusion:
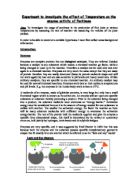
The results show that the optimum temperature for catalyse to work at is 20°C. Looking at the initial part of the reaction (see graph), between 10 and 20°c the gradient of the graph was quite steep. Between 20°c and 30°c the gradient of the graph was also steep, but after 40°C the line begins to level off.
These results partly do and partly do not support the prediction. As the prediction stated, the reaction time was slower at the coldest and hottest temperatures. This is because at lower temperatures the enzymes do not move with as much energy. This is because of kinetic theory, which states that the more heat energy a particle has, the faster, and with more energy, it will move. At 10°C the particles of the catalyse have less kinetic energy, so collide with the particles of the hydrogen peroxide with less energy. Therefore a reaction is less likely to take place, and less oxygen (in the form of froth) is produced. As the temperature rises the particles have more kinetic energy, so collide with more energy and produce more oxygen. This accounts for the steep rise in the gradient of the graph between 10°C and 20°C.
The activity of the enzyme catalyse decreases at higher temperatures because enzymes are proteins, and proteins are denatured at high temperatures. Denaturing is where the active site of the enzyme is changed, so the substrate (in this case hydrogen peroxide) can no longer fit into it. Enzymes only work if the substrate fits into to the enzymes active site, like a lock and key. The reaction then takes place and the product leaves. If the active site shape is changed the substrate will no longer be able to fit in. This means that the reaction can no longer take place, decreasing the amount of oxygen produced. Biological variation means that not all of the catalyse particles will be denatured at the same temperature, accounting for the gradual gradient of the graph between 30°C and 70°C.
In the prediction it was stated that the optimum temperature range of the enzyme catalyse would be 40°C-45°C. This was not supported by the results, which showed that the optimum temperature was 20°C. This is possibly because the catalyse used was in the form of potato. Potatoes, unlike humans, do not have a natural temperature of 40°C-45°C. The normal temperature of a potato is much lower than this. Therefore it is possible that the catalyse in the potato has evolved to have a lower optimum temperature, one of 20°C.
Evaluation
The results gained by this experiment probably have a high level of inaccuracy, as the uneven graph and deviancy in the results indicated. I therefore cannot state that my conclusion is completely accurate, as the results it is based on may be faulty.
In my method it was hard to gauge the amount of froth produced by the catalyse. At first 100 cm cubed measuring tubes were used, but as this made it very hard to read the amount of froth produced, these were replaced with 10 cm cubed and 50 cm cubed measuring tubes. The difference in size of these measuring tubes means that some results would have been measured with more inaccuracy than others would. To prevent this the same sized measuring tube should be used for all experiments.
For this experiment I measured the height of froth in cm cubed, but to be more precise I should have measured it in mm cubed. To make this experiment more accurate, I should use a measuring tube with mm cubed measurements. Another reason for inaccuracy in the experiment is the probable variation in size of the measurements. When measuring out the enzyme catalyse (in the from of potato) into the test tube, a lot of potato was left in the syringe, so it is likely that not enough catalyse was used in many of the experiments. Additionally potato covered the syringe in most instances, making it extremely hard to measure the catalyse accurately. To prevent this a clean syringe should be used for each measurement.
Another way of improving this investigation would be to ensure that only pure oxygen would be produced. As Hydrogen Peroxide is a very reactive substance, I would need to ensure it was reacting with nothing in the air. To do this the same equipment would be used, but I would place a rubber bung in the test tube after the hydrogen peroxide was added to the catalyse to ensure that no other gases entered the substance and that no oxygen would be lost.
The results for this experiment gave the optimum temperature for the catalyse as 20°C. Although I did suggest a reason for this in my conclusion, it is possible that my prediction was correct and that that result was a n anomaly. In order to ensure a greater reliability of results, I should have repeated each experiment 3 times. Unfortunately, there was not enough time to do this. In addition, when I plotted my results in a rough graph, (see below) I noticed that the result for 30°C did not fit in with the trend of the data.
I therefore looked at my data for the result for 30°C, and decided that the result 12 cm was an anomaly. It was possibly caused by too much potato being left in the syringe, meaning there was less catalyse in the experiment.
I believe I collected a suitable range of results for this experiment, as the results I collected enabled me to see a pattern clearly. However, as I believe that the pattern shown by my results would continue beyond the range specified, If I repeated this investigation I would develop it by also using the temperatures 0°C, 80°C, 90°C and 100°C. Another good way of developing this experiment would be to have the temperatures used closer together, e.g. 20°C, 25°C, 30°C, etc. Having closer together temperatures would make it clearer to see at what temperature which denaturing took place.