Weak sucrose solution Strong sucrose solution
(hypotonic) (hypertonic)
net movement of water molecules
High water potential/low osmotic Low water potential/high
pressure osmotic pressure
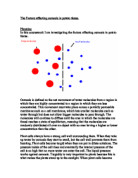
The potential energy of water molecules is known as the water potential and is represented by the Greek letter psi-. Pure water has the value of 0, the addition of solute particles makes the value negative.
The ‘push’ that osmosis gets its name from refers to the force of moving molecules in a solution against a membrane. This ‘push’ is known as the osmotic pressure. Whether a solution is hypotonic, hypertonic or isotonic with regards to the cell determines whether or not the osmotic flow of water will be into the cell (endosmosis), out of the cell (exosmosis) or balanced. If a cell is surrounded by a hypotonic solution that has a lower solute concentration and thus a lower osmotic pressure, it follows that endosmosis will occur, thus causing the cell to gain in mass and volume as well as turgidity. If a cell is surrounded by a hypertonic solution in which the solute concentration and hence osmotic pressure of the external solution is greater than that of the cell, exosmosis will occur resulting in a decreased mass, volume and turgidity. If there is a homogenous distribution of solute concentration and hence osmotic pressure between the cell and its surroundings, i.e. isotonic solution, no change in mass or volume should occur as there shall be no net movement of water. The following shows the difference in plant cells due to osmotic changes:
Cell in hypotonic Cell in isotonic Cell in hypertonic Cell in very hypertonic
solution: turgid solution solution: flacid solution: plasmolysed
Osmosis will not occur in cells whose membranes are not intact. For instance if the cell is denatured by heat, or plasmolysed, osmosis will not occur.
Having given a somewhat comprehensive treatment of osmosis and the factors that may affect it, we may now apply the key principles to make predictions regarding our three input variables:
Concentration
I believe that the vegetable will change mass, turgidity and volume depending on whether or not the solution is hypotonic, hypertonic or isotonic/isosmotic to the vegetable.
I predict, having explained osmosis in terms of the concentration gradient and thermodynamics, that the pure water, which has the greatest water potential, will cause the vegetable to increase in mass, volume and turgidity the most. This is as the potato no doubt contains some solute particles, and thus causing endosmosis across the concentration gradient. The 1mol/litre concentration is likely to be hypertonic to the potato and hence result in the greatest decrease in mass, volume and turgidity of the vegetable due to exosmosis. Somewhere between these two concentrations will be the water potential of the potato, this isotonic solution will thus cause no change in mass volume or turgidity. As the rate of osmosis is proportional to the gradient of concentration, in a given time change in mass and volume will be inversely proportional to the change in concentration i.e. proportional to the change in water potential of the solution Hence, when plotting percentage increase in mass or volume, the graph should look similar to this:
% change
in mass
/volume
0%
Concentration
Cross-Sectional Area
I believe that increasing cross-sectional area will increase the rate of osmosis proportionally. This is as a larger cross-sectional area will mean that there is a greater surface area in contact with the solution thus increasing the rate of osmosis. Hence, if we are using pure water, doubling the cross sectional area should therefore double the rate of osmosis and hence double the increase in mass and volume that the vegetable undergoes. Similarly, when using the 1 molar solution, doubling the cross-sectional area should therefore double the decrease in mass and volume. Hence a graph of percentage change in mass or volume, for a given concentration, against cross-sectional area should look as follows:
% change
in mass
/volume
Surface area
Temperature
The three temperatures being considered are 220C , 370C and 550C. 220C is room temperature, 370C is the optimum temperature at which enzymes can act and at 550C many enzymes are denatured and thus inactivated. As mentioned earlier, enzymes are thought to play an important role in carrier-mediated transport even in osmosis, and so inactivating them will thus slow down the rate of osmosis. Many cell organelles are denatured at 550C, however the cell membrane is able to withstand a few more degrees. Yet with the inactivation of the nucleus and many enzymes, it is unlikely that osmosis will occur. Although increasing the temperature from 220C to 550C will have a negative effect on the rate of osmosis, increasing the temperature to 370C will increase the rate of osmosis. This is as osmosis depends on the movement of particles, increasing the temperature of a particle increases it’s kinetic energy and so the rate of osmosis is proportional to the increase in temperature. However, where living cells are concerned, the temperature rise to 370C will not only increase the average speed of the particles, but will allow the cell to function at it’s optimum temperature-also leading to an increased rate of osmosis. Due to the fact that there is more than one factor that will be altered when increasing the temperature from 220C to 370C, the increase in the rate of osmosis is not likely to be proportional to this increase in temperature. When illustrated graphically, the rate of osmosis against temperature should look something like this:
Rate of
osmosis
22 37 55
Temperature
However, since the rate of osmosis determines the increase in length and volume, we may therefore assume that the graph of percentage change in mass/volume would be the same as above. And yet I believe that this is not so in the case of the experiment at 570C. I predict that there will be a change in mass and volume in this experiment, however, somewhat pedantically speaking, most of it will not be due to osmosis. This is as osmosis is very specifically diffusion across a selectively permeable membrane. However, since at this temperature the cell and thus the plasma membrane are denatured, there is no longer a selectively permeable barrier and so the likely change in mass and volume will be down to the porosity of the vegetable, i.e. it will thus be diffusion that occurs and not osmosis. Depending on the actual porosity of the vegetable, the change in mass or volume may even exceed the initial change at 370C as there will be no impeding barrier as well as the fact that the particles will be travelling at a faster average speed at this increased temperature. From our results we may thus asses the role of enzymes in osmosis concerning the potato. The effect of temperature on the osmotic pressure and hence the rate of osmosis is found by the equation:
P = nRT
V
Where n is the number of particles, R is the gas constant, T the absolute temperature i.e. in Kelvin and V is the volume. With an increased temperature we may thus expect an increased osmotic pressure and thus a greater rate of osmosis (although, as explained earlier a rise too high would kill the organism). Similarly, this equation applies to concentration as concentration is number of particles divided by volume.
Plan Of Investigation
Before we begin the investigation it is essential that we take various safety precautions. These shall include handling the equipment, in particular the scalpel, with care. It is also crucial that we keep our area used for experimentation tidy to prevent accidents.
The investigation shall proceed in three main parts, each dealing with one different independent or input variable. We shall first consider that of concentration. Given that we have sufficient time in which to carry out a thorough investigation, we shall conduct the investigation with regards to the effects of concentration using eleven different concentrations on the potato. The concentrations shall range from pure water to a 1 molar solution of sucrose in units of 0.1. In addition to this we shall also set up a control experiment. A control experiment is one that is set up to ensure that only the condition being tested has affected the results.. In this investigation we shall place the three different vegetables into a test-tube without adding the solution, if our predictions are correct, there should be no change in the mass or volume of the vegetable (-perhaps a minor reduction in mass/volume due to evaporation). With these results, I believe that we will be able to adequately evaluate our predictions. However our data would be more accurate if we used the method of averaging, i.e. repeat each experiment several times which is useful in order to reduce experimental error. However, it is unlikely that we will have sufficient time to use this method. In order to obtain a fair set of results regarding the effect of concentration, the following variables shall be constant:
- Type of vegetable used: Solanum tuberosum
-
The volume of solution used-15cm3
- The length of the cylinder of vegetable used-5cm
- The amount of time each vegetable is left in the solution-2 days
- The same vegetable used to obtain cylinders since two different
vegetables may have been exposed to different surroundings and hence
provide us with inaccurate results.
-
The temperature of the solution -room temperature 22oC.
- The cross-sectional area of the vegetable.
The steps that shall be taken are as follows:
Step1: I shall obtain one vegetable, and using a cork borer of radius 1cm, the volume of the cylinder, given that it shall be of length 5cm can thus be worked out using the formula:
Volume of Cylinder = x r2 x h
Volume = x 12 x 5 =15.7 cm3
I shall cut cylinders (eleven used for the different concentrations and one for the control experiment) from the vegetable, The cork borer is used to ensure that all the pieces are of the same diameter.
Step 2: The cylinders shall be aligned against a straight edge where they shall be cut to a length of 5cm. The straight edge is to ensure that the pieces are of exactly the same length. This may be illustrated as follows:
The length shall be determined using a ruler. A ruler is accurate to the nearest millimetre and so the accuracy is 5 + 0.001. It is thus very accurate. The percentage error may be worked out using the following equation:
Degree of accuracy x 100
Total measurement
0.001 x 100 = 0.02%
5
Step3: The cylinders shall be blotted dry using filter paper, before being weighed on a top-pan balance. They shall be blotted dry in order to receive an accurate reading of their weight. As all the cylinders should be of the same length, and as they are from the same vegetable, their densities should also be the same, we shall thus weihg them all and obtain the mean. A top-pan balance is accurate to 0.01 of a gram.
Step4: We must then obtain 15ml of distilled water. This shall be done, as in all the experiments by pouring the distilled water from the container into a measuring cylinder as shown below:
It is important that we take our reading from the bottom of the liquid meniscus to reduce error. A measuring cylinder is accurate to the nearest 1cm3. Therefore our measurement shall be 15cm3 + 1.
We may also find out the percentage error using the following equation:
Degree of accuracy x 100
Total measurement
1 x 100 = 6.7% (to 2.s.f)
15
Thus we may expect an error of approximately up to 6.7%. Although this does seem rather high, the only other measuring cylinder that we have, which is accurate to 0.1cm3, only has a capacity of 10cm3, and therefore is of no use.
Step4: We next have to make up a 15 ml solution of correct concentration and osmotic pressure. To make up a specific concentration of a solution of sucrose we use the formula:
Equation1) Concentration moles/litre =Amount of solute in moles
Volume of solution in litres
Equation2) Number of moles = mass
molecular mass
As we know the required concentration and the volume required, we therefore alter the formula to find the number of moles of sucrose required:
Amount of solute (mol) = Volume of solution (l) x Concentration (mol/l)
For example, to make a ½ molar solution, as we are using 15 ml of water i.e 0.015 litres, using equation 1, we thus multiply ½ by 0.015 which equals 0.0075 moles. Now, to find the mass required we rearrange equation two placing mass as the subject:
mass = Number of moles x molecular mass
given that the molecular mass of sucrose is 324g
mass = 0.075 x 324 = 2.43g.
The osmotic pressure of the solution may be found using the formula:
P = nRT
V
It has thus been found that a 1molar solution of sucrose has an osmotic pressure of 245kPa. The osmotic pressure that leads to no increase or decrease in mass or volume of the vegetable, is thus equal to the osmotic pressure of the vegetable.
All the masses of sucrose required to be added to the 15ml of water and osmotic pressures are worked out in a similar way and are shown on the following table:
Concentration (mol/l) Osmotic Pressure (kPa) Mass (g)
0 (pure water) 0 0
- 24.5 0.49
- 49 0.97
- 73.5 1.46
- 98 1.99
- 122.5 2.43
- 147 2.92
- 171.5 3.40
- 196 3.89
- 220.5 4.37
1 245 4.87
The concentrations will be made up in a beaker and not in a test tube, this is as the test-tube may break whilst we are using the glass-rod to stir the solution and to make sure that all the solute particles dissolve.
Stage5: The vegetable cylinder will then be added to the required concentration inside a test-tube where a rubber bung will be placed to prevent the solution evaporating. This may be illustrated as follows:
Rubber bung
Test-tube
Vegetable
Required concentration
The test-tube is then placed in a rack and left for two days. It should not be placed in an area where it is likely that there will be a drastic change in temperature i.e. not directly exposed to sunlight.
The above stages will be done for all the ten required concentrations. A control experiment will also be set up to make sure that the changes are due to the solution and nothing else. The control experiment will thus be a potato in a test-tube with no solution present:
Rubber bung
Test-tube
Potato
Air
Our results for this experiment are to be plotted on a table with values for the concentration, the change in mass, volume and turgidity. We shall also plot a graph of percentage change in mass against concentration as well as percentage change in volume against concentration.
Having considered concentration we may consider the method to be used to find the effect of temperature.
The temperatures we shall use are 220C , 370C and 550C. Two different concentrations will be used, i.e. 1mol/l and pure water in order to test the effect of temperature on endosmosis and exosmosis, thus allowing us to gain a broader insight in to the effect of temperature on osmosis. Therefore 6 test-tubes will be required. With these results, I believe that we will be able to adequately evaluate our predictions. However our data would be more accurate if we used the method of averaging, yet it is again unlikely that we will have sufficient time to use this method. In order to obtain a fair set of results regarding the effect of concentration, the following variables shall be constant:
- Type of vegetable used: Solanum tuberosum
-
The volume of solution used-15cm3
- The length of the cylinder of vegetable used-5cm
- The amount of time each vegetable is left in the solution-2 days
- The same vegetable used to obtain cylinders since two different
vegetables (of the same type)may have been exposed to different surroundings and
hence provide us with inaccurate results.
- The cross-sectional area of the vegetable.
The steps that shall be taken are as follows:
Step1: I shall obtain one vegetable, and using a cork borer of radius 1cm, cut a total of 6 cylinders .
Step2: As described earlier, the cylinders shall be aligned against a straight edge where they shall be cut to a length of 5cm.
Step3: The cylinders shall be blotted dry using filter paper, before they are weighed on the top-pan balance.
Step4: We must then obtain 15ml of distilled water. This shall be done, as described earlier. Required concentrations will the be made up. The concentrations shall be pure water and a 1molar solution.
Stage5: The 6 cylinders will be placed in the required solution of sucrose. Two for room temperature-at two different concentrations, another two will be placed in a water tank heated to 37 0C-again at two different concentrations. The water is there to make sure that all parts are heated to the same temperature. The remaining two will be placed in a water tank heated to 570C- again at the two different concentrations.
Our results for this experiment are to be plotted on a table with values for the temperature, concentration, the change in mass, volume and turgidity. We shall also plot a graph of percentage change in mass against temperature as well as percentage change in volume against temperature.
Having considered the two independent variables of concentration and temperature we may now consider the method to be used for the experiment dealing with cross-sectional area. Given that the radius’ used shall be 0.5cm,0.7cm and 1cm
the cross sectional area may thus be found by the formula x r2. The cross-sectional areas are thus 0.79, 1.54 and 3.14cm2. Two different concentrations will be used, i.e. 1mol/l and pure water in order to test the effect of surface area on endosmosis and exosmosis, thus allowing us to gain a broader insight in to the effect of surface area on osmosis. Therefore 6 test-tubes will be required. With these results, I believe that we will be able to adequately evaluate our predictions. In order to obtain a fair set of results regarding the effect of concentration, the following variables shall be kept constant:
- Type of vegetable used: Solanum tuberosum
-
The volume of solution used-15cm3
- The length of the cylinder of vegetable used-5cm
- The amount of time each vegetable is left in the solution-2 days
- The same vegetable used to obtain cylinders since two different
vegetables may have been exposed to different surroundings and hence
provide us with inaccurate results.
- The temperature of the solution.
The steps taken shall be as follows:
Step1: I shall obtain one vegetable, and using cork borers of radius 0.5cm,0.7cm and 1cm, cut a total of 6 cylinders-two of each cross-sectional area.
Step2: As described earlier, the cylinders shall be aligned against a straight edge where they shall be cut to a length of 5cm.
Step3: The cylinders shall be blotted dry using filter paper, before they are weighed on the top-pan balance.
Step4: We must then obtain 15ml of distilled water. This shall be done, as described earlier. Required concentrations will the be made up. The concentrations shall be pure water and a 1molar solution.
Stage5: The vegetable cylinder of required cross-sectional area will then be added to the required concentration inside a test-tube where a rubber bung will be placed to prevent the solution evaporating.
Our results for this experiment are to be plotted on a table with values for the surface area, concentration, the change in mass, volume and turgidity. We shall also plot a graph of percentage change in mass against cross-sectional area as well as percentage change in volume against surface area
Observations
Having performed the experiments, we noticed that in all the experiments their was a smell of ethanol. Ethanol is formed by anaerobic respiration and is formed, in plants, in the cytoplasmic matrix:
Glucose enzymes in cytoplasmic matrix Ethanol + Carbon dioxide + Energy
C6H12O6 C2H5OH CO2 210kJ/mol
The strongest smell of ethanol was observed in the potato that was placed in the water-tank at 370C. There was a feint smell in the test-tubes at room temperature and surprisingly a feint smell in those at 550C. The fact that ethanol was produced in the water tank at 550C suggests that some enzymes were still activated. This leads me to suspect an inadequacy in my method.
Regarding the variable of concentration, the total mass of potato was found to be 69.72g. Thus one potato weighs 69.72 / 12= 5.81g.
In the second independent variable, that of temperature, the total mass was found to be 35.58. Thus one potato weighs approximately 35.58 / 6 = 5.93g
For cross-sectional area the total mass of 3.14cm2 was 10.44. Thus one potato of cross-sectional area 3.14cm2 weighs 11.58 / 2 = 5.79. Using the cross-sectional area of 1.54 cm2 the mass of two potatoes was found to be 5.70. Thus the individual mass is 5.70 / 2 = 2.85g. Using the cross-sectional area of 0.79cm2, the mass of two was found to be 2.94g. Thus the individual mass is 2.94 / 2 = 1.47g.
In order to asses the change in turgidity, I have devised a convenient scale based on approximate estimations. The scale is from between 1-5 in which 5 is fully turgid and 1 is fully flaccid. All cylinders have been found to be, before being placed in solution, approximately 4 on this scale.
Results
Our results may be tabulated and illustrated graphically as follows:
Conclusion
The results obtained show much of what was predicted to be correct. With regards to the effect of concentration, the results clearly show that the change in mass, volume and turgidity was largely determined by whether or not the external solution was hypotonic, hypertonic or isotonic to the potato. From looking at our results showing the change in mass against concentration, we see that the pure water solution produced the greatest increase in mass (16.35%) whilst the 1molar solution produced the greatest decrease in mass (-33.39) as predicted. The line of best-fit shows negative correlation- percentage change in mass seems to be inversely proportional to the concentration of the external solution, i.e.:
% Change in Mass α 1
Concentration
⇒ % Change in Mass = k
Concentration
Most points correspond to the linear trend-line within an x and y-axis error margin of 5%. However, the point that seems least accurate is that obtained from the 0.1molar solution. This is most likely to be due to inadequacies in taking the initial mass and volume measurements. From the trend-line it appears as though the water potential of the potato is approximately equal to the water potential of the 0.36 molar solution. Thus: hypotonic solution • 0.36 • hypertonic solution.
The results showing change in volume against concentration show that the greatest increase in volume came from using the pure water solution (8.03%), whilst the greatest decrease in volume was produced by the 1molar solution (20.89%). Our results thus show that change in concentration produces a larger change in mass than in volume. Although the trend-line shows inverse proportionality, three points seem out of place. At 0.1, 0.2 and 0.3 moles per litre there is no recorded change in volume. This may be due to experimental error, however it is more likely that it is explained by the trend found in change in turgidity. Whilst the potato was rated at 4 on the scale described earlier, although there was change in mass, there appeared to be no change in volume. This may be due to the fact that when the potato is changing turgidity, the extra water gained/lost is used to change it’s turgidity whilst keeping volume constant, once it has changed the water gained/lost does change the volume but not turgidity until it reaches a point where the turgidity is going to change again and so on... The water potential of the potato, from the trend-line appears to be 0.24, however the result obtained earlier 0.36 is more reliable.
The control experiment has also served to confirm my predictions. There was a negligible change in mass (-1.55%) and none in volume of the cylinder in the control conditions. This minor decrease is likely to be due to evaporation or an error in taking the weight of the cylinder.
Regarding the effect of temperature on the rate of osmosis, when using a temperature of 370C, as predicted, change in volume and mass appears to be substantially greater than when using 22 or 550C. This may be due to the increased efficiency of the enzymes -suggesting a role played by enzymes in osmosis, or due to the increase in kinetic energy of the water molecules, or both.
By looking at the graphs illustrating change in volume and mass in pure water, increasing the temperature to 550C appears to have decreased the rate of osmosis to less than it was at 220C. This clearly shows that increasing the temperature to a point that denatures the cell membrane, cell organelles and enzymes decreases the rate of osmosis considerably. Yet to determine which of these three things that have become denatured by heat has affected the rate of osmosis requires further, more sophisticated experiments.
Yet in the 1molar solution, the graphs of volume and mass against temperature show that at 550C the rate of osmosis is greater than at 220C. What this may be seen to suggest, is that enzymes play a greater part in endosmosis than in exosmosis. However, the differences may be down to experimental error.
Regarding cross-sectional area, it appears as though, in accordance with my predictions, that the change in volume and mass is directly proportional to the increase in cross sectional area. The pattern appears the same regarding endosmosis and exosmosis. However, change in cross-sectional area, as in our experiments regarding concentration, seems to have had a greater effect on mass than on volume. Our results concerning change in volume seem to be less accurate than those concerning mass as far less points seem to correspond within an 8% error margin to the line of best fit. This may be due to experimental error, however it may again be due to the same trend noticed in our first independent variable with turgidity change.
By comparing the gradients of the trend-lines of the graphs involving concentration and surface area, we find that those of concentration are in all cases steeper and thus concentration has the greatest effect on the rate of osmosis. To compare the two with the effect of temperature is somewhat more difficult as it produces a curved graph.
Although our results appear to have shown much of what was predicted to be correct, they do not allow us to generalise regarding what we have found. For example, although we have found that increasing the temperature to 370C increases the rate of osmosis we have only found this to be true regarding a potato, it may not necessarily be true regarding a different plant and so the theories and models that our experiments have illustrated may not necessarily be applicable in all cases. Putting in mind the tentative nature of hypothesis testing, our results thus do not disprove certain statements such as increasing the temperature to 370C increases the rate of osmosis in all plants. In order to obtain a broader insight into osmosis in living things, we must therefore conduct many more experiments on different living things.
If the experiment was performed again, various steps may be taken in order to improve the accuracy of our results. If performed again the vegetables should be left for a longer period of time so the changes can be clearer, however not too long so as to allow the cell turgidity to prevent further endo/exosmosis. Also the measurements used were accurate to the nearest millimetre, this is rather large considering the size of the cells that are being worked on. Thus vernier callipers or even a micrometer gauge may be used to obtain more accurate measurements. Also, a repeat experiment may take into account the fact that the change in diameter across the cylinder was not uniform.
Other experiments that may be done on osmosis using a ‘Visking’ or dialysis tube as an artificial partially permeable membrane. The effects of osmosis on cells may also be studied microscopically. A small piece of epidermis from a red area of a rhubarb stalk placed on a cover slip whilst soaked in a 30% solution of sucrose would be ideal for showing the effect of plasmolysis on cells. Further experiments on the role of enzymes in osmosis as well as other experiments concerning different methods of transport such as active-transport may also be conducted.
Bibliography
Biology a Functional Approach by M.B.V Roberts
Plants and Water by J.F. Sutcliffe
Biology the Network Of Life by Paul Farber
GCSE Biology by D.G. Mackean
Key Stage 4 Biology by Martin Barker
The Donnan effect describes the net flux of ions across an electrical gradient. It is important in the body because of the presence in cells and plasma of large non-diffusable protein ions.
Random movement of particles was discovered in 1827 by the British botanist Robert Brown, hence the term Brownian motion
The foundations of the modern cell theory were laid by Robert Hooke in 1665, a prominent biologist and technician. First proposed by M.J. Schleiden and Theodore Schwann in 1839, the theory states that cells are the basic units of an organism. With the discovery of the electron microscope earlier this century, our entire concept of the cell has virtually been revolutionised.
M.B.V Roberts, Biology a functional approach, published by Thomas Nelson and Sons Ltd 1987,p14
D.G. Mackean, G.C.S.E Biology, published by John Murray 1993, p24
Thermodynamics is the field of physics that describes and correlates physical properties of systems to matter and energy. Its principles are of fundamental importance in all fields of science.
Osmos in Greek means push.
The word turgid comes from the Latin word turgere meaning to swell.
Plasmolylsis comes from the two Greek words plasma meaning molded and lysis meaning loosening.
The absolute or Kelvin scale was invented by the British mathematician and physicist William Thomson, and is most commonly used in scientific work. In this scale ,zero K corresponds with absolute zero or -273.16° C, with degree intervals similar to those on the centigrade scale.
A mole is a convenient unit used by chemists in the laboratory. A mole (abbreviation mol) of any substance is the number of particles making up the Avogadro constant (6.02 x 10²³ particles)
Anaerobic-in the absence of air