These are the currents I will be testing: 0.5, 1.0, 1.5, 2.0, 2.5, 3.0, 3.5, 4.0 and 4.5
METHOD
Apparatus:
∙ Electrical heater
∙ Cup
∙ Thermometer
∙ Clamp stand
∙ Water
∙ Measuring cylinder
∙ Power pack
∙ Ammeter and voltmeter
∙ Electrical wires
Procedure:
Firstly, the circuit was set up with the heater, ammeter in series, voltmeter in parallel, and the power supply. 75cm³ of water was then measured out in a measuring cylinder and was poured into the cup. The heater was then placed in the water together with a thermometer, which was fixed to a clamp stand so that it would not fall over. The knob on the power pack was then adjusted so that the required current was acquired. And then the stopwatch was started. Then, after 10 minutes, the stopwatch was stopped and the temperature was measured. This was then repeated, four times with varying currents.
Accuracy:
∙ Make sure the thermometer is straight and you are eye-level with it when reading it.
∙ Stir the water with a pencil every now and again so that the heat is evenly distributed.
∙ Make sure that the thermometer is not touching the heater so as not to obtain inaccurate results.
Safety:
∙ Make sure not to spill the water, as it is very hot.
∙ Do not sit down while performing the experiment, so it is easier to move away if the water spills.
∙ Make sure the thermometer is securely clamped.
∙ Be careful not to let any water get into the mains socket.
∙ Make sure there is water in the cup before turning the heater on, or the heater will burn and get ruined.
PREDICTIONS
After carrying out my preliminary studies and also after studying some textbooks, I have been able to make a prediction:
I predict that the temperature rise will depend on the energy input. As the current is doubled, the rise in temperature will also double.
(Current is proportional to voltage)
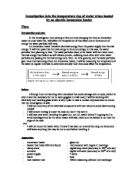
So I will expect the graph to look like this:
From the graph showing current against the average change in temperature, it can be seen that as the current is increased, the change in temperature also increases.
The graph shows direct correlation between the current used and the average change in temperature.
However, the graph is not proportional like I expected it to be in the prediction I made. The line is a curve, and for it to be proportional, it would have to be straight. Therefore, the change in temperature does not double when the current is doubled.
However, the basic prediction was still correct, that the higher the current, the higher the average change in temperature. The reason for this is as I explained in the planning section.
I took out da boffination in this part cus it wud be obvious dat u copied me if u used it… but its all dis madness 2 do wit da formalas and dat….
There were quite a few reasons for why my results may have been inaccurate:
∙ It takes some time for the heater to heat up, so the first few runs would have been different from others.
∙ Also, as the experiment was done over a period of many days, the temperature would have been different on each day, meaning that the water would heat up quicker than on some days than others.
∙ As we used different ammeters, the current could have slightly varied for some of the runs.
∙ The thermometer and heater was not always placed the same distance away from each other, so this would mean that it could take longer for the temperature to go up on the thermometer when it is a little further away from the heater.
∙ There was no way to make sure that the heater heated all of the water. All I could do was stir the water every now and again but this was probably not good enough for the results to be completely accurate.
∙ Tap water was used. The hardness for the water used in a run could have been different from the water in another. The harder the water, the longer it takes to heat.
Even though when averaged out, there did not seem to be any anomalies, there were some when graphs were drawn for the individual runs. In run 2, there was a completely odd temperature change for 5 amps. I think maybe the reason for this was the thermometer was practically touching the heater, meaning that the temperature would go up very quickly.
The prediction I made did not completely agree with the results. The graph was not proportional as I expected it to be. The line is a curve, and for it to be proportional, it would have to be straight. Therefore, the change in temperature does not double when the current is doubled.
The only way I can explain this, is that the water must tend to lose more heat to the container and its surroundings when it gets hotter. This explains why the graph showing current against change in temperature was a curve and not a straight line.
I think the experiment was very fair, given the circumstances. However, I could have made it fairer by using the same ammeter and voltmeter every time. Also, I could have done the whole experiment in one day, meaning that the surrounding temperature would not change by as much. Another thing I could have done was measure the distance between the thermometer and heater and made sure that this stayed the same. I could have also used distilled water so that the hardness was the same in every experiment. Finally, I could have put some type of mechanical stirrer in the cup so that the water would be heated evenly.
To extend my experiment, I could have measured the change in temperature after a constant time, while varying the current each time. I could have also varied the mass of the water. Another thing I could have done was experiment with a larger range of voltages. This would give me a larger view of how the current affects the temperature change and would have helped me come to a firmer conclusion.
Even though my results did not turn out as I expected, and they were not completely accurate, I can still draw a firm conclusion from them:
The higher the current is, the higher the change in temperature