R1 + R2
=
RT
Variables
Independent - The thing I will change will be the length of the eureka wire.
Dependant - I will be measuring Voltage in Volts and Current in Amps.
Controlled - I will be keeping the same the temperature, the type of material, the cross sectional area, the power pack, the voltmeter and the Ammeter.
Prediction
I predict that long wires will have long resistance and that short wires will have short resistance. I believe that this will happen as in a longer piece of wire there would be more atoms for the electrons to collide with thus increasing the resistance.
I will put my results in a table and from them I will create a graph with length on the x-axis and the average resistance on the y-axis in ohms. It will be a scatter graph and will contain a line of best fit.
In the graph I would expect to find a directly proportional relationship between length and resistance. I would expect to find that for a steady increase in length there should also be a steady increase in resistance. The relationship between length and resistance should be directly proportional.
If you doubled the length of wire you would expect to find double the resistance. For example there should be twice as much resistance in a 100cm length of wire compared to a 50cm length of wire. This would be because there are twice as many atoms, which would mean more collisions with the electrons. Likewise if you increased the length by 20% you would expect to find a 20% increases in resistance.
Apparatus
- Lab pack
- Variable Resistor
- Ammeter
- Voltmeter
- 200cm Eureka wire
- 2 1m rulers
- 4 crocodile clips
- 2 wires
Diagram
Method
- Gather the apparatus
- With a wire connect the black terminal of the lab pack to the com terminal of the Ammeter
- Set the Ammeter to the 200mA setting.
- Set down the two rulers with the eureka wire cello taped to it.
- Connect a crocodile wire from the 10 ADC terminal in the ammeter and clip it to the eureka wire at 0cms.
- Connect a crocodile clip from the Com setting on the voltmeter and clip it to the 0cm mark on the eureka wire also
- Connect another crocodile clip from the V terminal in the Voltmeter and clip it to the 50cm mark of the eureka wire.
- Set the Voltmeter to the 20V setting.
- Connect one side of the variable resistor with a crocodile clip to the 50cm mark as well.
- With a wire connect the other side of the variable resistor back to the red terminal of the lab pack.
- On the variable resistor put the sliding contact into the middle.
- Check the circuit to make sure it looks right and that everything is in place.
- Turn on the lab pack at its lowest power.
- The apparatus will be used to find the current and voltage of different lengths.
- Lengths will be measured from 50 to 130cms at 10cm intervals.
- To get the different lengths, the crocodile clips at 0cm will stay the same and the two at 50 will move up to 130cms at 10 cm intervals.
- When setting up the apparatus the length was at 50, look at the Voltmeter and Ammeter and record the current and voltage.
- Repeat this for the 60,70,80,90,100,110,120 and 130 cams length.
- Then repeat the whole thing again twice and you will then end up with three sets of results for Voltage and Current. This will make results more accurate when we come to find resistance.
- The values that have been recorded for Current are in milliamps and they need to be changed into Amps. Dividing the results for current by 1000 does this.
- Once that is done you must find out the resistance out of your results.
- This is done by using Ohms Law.
- You use the calculation
V
R =
I
- It means you divide voltage into current to get resistance.
- You will do this calculation for all three sets of your results thus meaning you will have three sets of resistance results, each set going from 50-130cms in 10cm intervals.
- You will then find an average resistance for each of the lengths, to do this you add your three resistance results for the length up and divide them by 3.
R1 + R2 + R3
= Average Resistance
3
- You will then record all of your results in a table.
- All results will be recorded to 3 significant figures.
- The headings will be as follows, length (cm), Voltage (V), current (A) and Resistance (Ω).
- You will have three columns for Voltage, Current and Resistance as you have three sets of results for each.
- From the results you will then make a scatter graph.
- Length in cm will be on the x-axis and Resistance in ohms will be on the y-axis.
- A line of best fit will be drawn through the origin.
- From the graph you will find the gradient of your line of best fit. You will do this using the following formula
Rise
Gradient =
Run
- Notify two easy points on your line of best fit and use them for you calculation. It is best to find the gradient as it does not account for anomalous points
Results Table
Conclusion
From doing the experiment I have found out that as the length increases resistance also increases.
The results back this statement up, as there was an uphill slope on the line of best. There was strong positive correlation between the two quantities. The table of results showed that long wires have a high resistance and short wires have a low resistance. Some of the results are shown below and they back the point up. The gradient was 0.12.
50cm – 6.2Ω
60cm – 7.48Ω
70cm – 8.59Ω
80cm – 9.93Ω
From my results I also noticed that if the length is doubled the resistance is also doubled. The resistance for 50cm of wire was 6.2Ω and the resistance for 100cm was 12.4 Ω. This is exact and shows that when you double length resistance is also doubled. The resistance for 60cm of wire was 7.48Ω and the resistance for 120cm was 14.9Ω. This is not exact however proves the point as it is very close.
I also noticed that there should be a percentage change as well. I would try and find out if there was direct change. If you increased length by 25% you should get a 25% increases in resistance. The percentage change in length is shown below.
100 - 80
X 100 = 25%
80
The percentage change in resistance is also shown below. The resistance at 100cm will be subtracted from the resistance at 80cm and then it will be divided into the resistance at 80cm and then multiplied by 100.
12.4 – 9.93
X 100 = 25%
9.93
As a result of the calculation on percentage increase I believe there may be a directly proportional relationship between length and resistance. I will do 2 more examples of percentage increase to see if there is a directly proportional relationship. The percentage change for length of 60 and 80cm is shown below.
- 80-60
X 100 = 33%
60
And
9.93-6.2
X 100 = 33%
6.2
- 110 – 80
X 100 = 37.5%
80
And
13.7 – 9.93
X 100 = 38%
9.93
The second example shows that there is not a directly proportional relationship however it is very close.
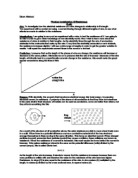
The length of wire influenced the resistance simply because there was more resistors in series. In 50cms of wire it is like having 5 resistors of 10 Ω whereas in 100cm of wire it is like having 10 resistors of 10 Ω. It shows us that as length increases so does resistance.
50cm =
100cm =
The reason that in a long wires there is high resistance and in a short wire there is low resistance is because in a longer piece of wire there is more atoms for the electrons to collide with thus increasing the resistance. There are not as many atoms in a short wire so there are not as many collisions.
Evaluation
My results were good and showed strong positive correlation however improvements could be made. I could have used the milivoltmeter setting on the voltmeter instead of the volt setting. The temperature of the wires could also have been kept down as when the wires get hotter the atoms vibrate more vigorously, the electrons are then more likely to bump into the atoms which means resistance has increased. Turning off the lab pack and letting the wires cool down or by using different wires each time could prevent this. I could have got more reliable results if I had measured voltage and current four or five times as this would have resulted in a more accurate average resistance. I could have used the Ohms Law experiment to find voltage and current. The experiment involves moving the variable resistor over different positions and recording 7/10 pairs of values for voltage and current. These values are plotted on a voltage/current graph for each length and the resistance is calculated from the graph. The advantage of using the graph to calculate resistance is that it does not account for anomalous points.
In my prediction I said that the longer the wire the greater the resistance and this was proved when I done the experiment. However in the graph I expected to find that a steady increase in length would result in a steady increase in resistance, which was true however there was not a directly proportional relationship, which is what I thought there, would be. I also stated that double the length would result in double the resistance. I did a few examples and found out that this statement was not 100% through but it was very close. The same applies for the percentage increase I did many examples and all but 1 was right and this shows that it isn’t exactly true but it is near enough true.
Anomalous points could have been created as the voltmeter fluctuates. Clips also might not have been set to the right values on the wire, for example if it was to be set to 50cm by accident the clips could have been at 51cm.