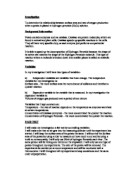
Food to be broken down
Enzyme Catalyst Broken Food
Starting to brake up
Prediction
I predict that as the substrate concentration increases, the rate of reaction will go up at a directionally proportional rate until the solution becomes saturated with the substrate Hydrogen Peroxide. When this saturation point is reached, then adding extra substrate will make no difference. The rate steadily increases when more substrate is added because more of the active sites of the enzyme are being used which results in more reactions so the amount of oxygen released in a certain time is higher. Once the amount of Hydrogen Peroxide molecules added exceeds the number of active sites available then the rate of reaction will stop going up. This is due to the maximum number of reactions being done at once, so any extra substrate molecules have to wait until some of the active sites become available. So the higher the temperature the less affective the enzymes will be, and the lower the temperature the same will happen both coming to a point where they seas working.
Equipment
- Test tube
- Measuring cylinder
- Potato
- Hydrogen Peroxide
- Clamp stand
- Plastic tube
- Washing up bowl
- Water
- Safety goggles
- Stop watch
- Bunsen Burner
- Ice water
Diagram
Method
First we start by gathering the equipment we need, then we put the evenly sliced potato into a test tube, then we added the hydrogen peroxide to start the reaction (enzymes) with the potato. We will then place the plastic tube from the test tube to the measuring cylinder which was placed in a ¾ full washing up bowl. Fill the measuring cylinder with water and turn upside-down, we will use the clamp stand to hold this and the pressure will keep the water in, then we will feed the plastic tube up into the measuring cylinder. Then start the reaction. The oxygen will travel through the tube and into the measuring cylinder, this will then replace the water with oxygen, thus we will take readings every 30 seconds or count the bubbles. Both these methods work well and accurately, to a curtain extent.
Results
I carried out the experiment above and I obtained these results.
Analysis
The pattern on my graph shows and proves to me that enzymes work at there full potential at normal body temperature (37oc ). There are 3 readings that that skip the preferred readings they are at 25oc the water lost dropped when it should have kept rising, this is more likely to be human error rather than equipment malfunction. Also at 55oc the water lost increases rather than following the best fit line going decreasing, this is imposable because enzymes will eventually stop working all together if the temperature is to high. From my results I found out that human error such as, there is a slight delay between placing the cork stopper in the end of the test tube. This will slightly affect all the results for each individual experiment but as I carried out all the steps in the same way, it should not make any negotiable difference to the overall result. As I have said enzymes work best at normal body temperature, but they can also work to the same affect at a higher temperature like 40-41oc , this maybe because when you are ill with a fever that give you a high temperature, your enzymes still need to digest food and continue working, If they died at this temperature then we would find it hard to stay alive. Compared to my prediction I was 99% correct, the only thing I didn’t expect is the enzymes to work a little over 37 oc , so my prediction was almost perfect. In a perfect situation I would have seen my graphs rate of reaction go up directly proportional to the temperature, without any anonymous readings.
Evaluation
My results show that I haven’t followed my method precisely, but I have done the necessary to give me enough information to show that the relationship between temperature and the amount of oxygen produced. There are some anomalies in my graph, this proves that my results weren’t perfect, but because I used a large range of temperatures this doesn’t matter too much. I think my results could have been more accurate by using more professional equipment also by counting the amount of bubbles instead of the amount of water lost. There were only 2 points of results in my graph that were way of the best line. To enable this experiment to be completed as accurate as possible, I repeated it three times and then used and then used an average of all the results to best plot a graph with a line of best fit. I tried my best to keep all the variables apart from the one I was testing (Temperature) the same. To improve my results I could have also taken more time over the experiment, reading the measuring cylinder allot more closely and precisely, taking in the fact of the water line. I think my test was fair, even though they weren’t 100%. I don’t think it would have affected my results. How ever If I had a chance to do the experiment again I would follow the plan in allot more detail
Conclusion
I conclude that enzymes have to work in a changing environment, not only in temperature but in size, maybe the size of the biological creature or the plant. These all change as we grow to be older. Also they must be able to work over and under normal body temperature, to be successful. They need to adapt to there surroundings to enable them to work at there best. I am happy with my experiment because it proves to me that I can proceed with a decent experiment that will give me the results I need. Also I think that amylase would be affected by the ph level because they are protein. Because amylase is neutral (ph7) if the ph level were to increase (either more acid or alkali) the rate of reaction would be affected as well. Because we did the experiment over time we used different equipment every time which could have affecter the results dramatically. So all in all my experiment was a success.