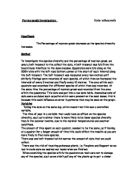
In regards to the above diagram it is clear to see that in every meter I will place my quadrat onto the ground. This will help me to investigate the number of species, which are present until I reach my target of 10metres. It will be crucial for me to measure the light intensity, every metre using a light metre. This will help me to see where and why the light makes a difference to the number of species being counted in the quadrat at a certain point.
Next I will be taking the soil depth by using a soil pin and placing it into the soil with a little push. I will then inspect the point where the soil pin has stopped. I will then measure the soil pin onto the ruler to find out the measurements of the deepness of the soil.
Finally I will take soil samples to analyse the pH and examine any differences, which may occur. I will do this by taking soil samples with a spoon and placing them into separate containers. I will then place the samples of soil into separate beakers with distilled water and stir them.
So once the solution has been formed I will be able to take down the pH using the pH pen. This information will be displayed on the screen.
I will be monitoring the pH level for every sample and will be washing off the soil. This is because the previous samples may affect the next sample results.
How to make it a fair test:
I will be using the same apparatus and material in an appropriate and safe way so that no key differences occur. By carrying out the work in a systematic way by taking into account the safety guidelines for all well being and living organisms. I will also try not making a mess during my investigation in case of any uncertainty.
I will be using a interrupted belt transect with intervals of one metre and then every other metre, I will be doing this four times around the tree and maybe another four times if I have enough time to make my results trustworthy, I will doing the same thing during each co-ordinate to see what differences occur.
Safety Procedures/risk assessments:
The area that I was working in was an outdoor area where many people were doing their investigations. However, there were not many teachers or assistants available all the time. Therefore, I took a first aid kit, which had the vital equipment. This would help if any other student had an accident or if I injured myself.
When I was carrying out my investigation there were two teachers and assistants that were close by at some times also which were there to help everyone. These adults made sure that students were being sensible and that equipment was being appropriately used. They were also monitoring to see which skills we were using.
Many students who were working on the hills needed adult attention. Therefore these students had the adults with them. Students also gave their mobile numbers for safety reasons.
Also the environment was looked after, as there are estate management groups, which were expecting the condition of the areas to be kept the same, and was not to be touched or removed in any way unnecessarily. This was taken into account, as this would affect many people’s results.
They were also there to see if the students threw any litter, as there are not any litterbins in the outdoor areas, which could influence some student’s work to dump their litter anywhere.
Observations during investigation:
The problems that I faced during the experiment was that I had to walk carefully around my experiment as I was continuously walking up and down, this could have affected my results.
Due to weathering it was tough for me to find out where the plants where as many of the plants were decomposed and it was hard to research. There was a lot of leaf litter, which was starting to get confusing when there was a lot of leaf litter in certain areas.
I also had problems whilst moving the measuring tape from one place to the other. I had placed particular objects on each end of the tape due to the weather, it was extremely windy during some points and when I had to move the tape around the tree it was difficult to do myself.
I also faced problems with the pH meter. When I tried looking for a meter it was difficult for me to find one. I could not afford to make a mistake with the soil sample because I would have to wait for my turn to re-use it.
Variables:
Independent Variables: the factors that I will change. In this experiment the variables that I will be making changes to, would be the co-ordination of where I will be placing my quadrat in the region of the 10 metres.
Dependent Variables: the factors that I will measure during his investigation will be the:
Depth of the soil: so I can see if there are more species present where there is more soil or less soil available. Measuring the soil depth with extra care will control this variable as I will not force it into the soil.
How many species present in the quadrat: the most important variable will be measuring how many species are present on different co-ordinates of the soil using a quadrat. I will be able to identify the frequency of species present and not the type of species present in the quadrat. Measuring the species present accurately with the correct equipment will control this variable.
Soil pH: I will also take note of the soil pH to see whether the soil is neutral and to see if this is a factor, which affects my results. Using the pH meter correctly will again produce reliable results.
Light Intensity: I will be using this to see where there is more light available and to find out why there is more or less light available in specific places and to see if this is a factor which affects my investigation. Using the right equipment for this particular experiment will result in controlling this variable.
I will do all this research to analyse my results and see whether they match to my predictions. I decided to collect this amount of data, which will make my results more accurate and reliable.
So overall measuring each factor with the correct equipment and accurately will control all these variables.
Biological knowledge:
The number of species per sample is a measure of richness. The more species present in a sample, the 'richer' the sample. As the light intensity increases the number of species increase, as there is more light available. But in my case the woodland floor was essentially bare of vegetation as a result of the extremely low light conditions prevailing. Light access in most areas was significantly less than 10% of full daylight. So this resulted in a decrease of species during my experiment.
Roots anchor the plant to the ground so it doesn’t blow away, they have root hairs which stick out into the soil and gives the plant a big surface area for absorbing in water and minerals from the soil the roots are therefore necessary for nutrition in order for the plants to grow and be healthy.
The concentration of solutes, such as ions, is very low in the soil water of most soils, so the water potential of this water is close to zero, so there is a water potential gradient between roots hair cells and soil water, and therefore water will be taken up by osmosis. Towards the root of the tree there were less plants as there was not enough water and sunlight available there, as the plants did not get their water and nutrition they died and turned into leaf litter.
The xylem tube will then carry the water and minerals from the roots up to the leaves in the transpiration stream. The roots then expand and there is more water and more competition, which increases the number of species. This happened at the beginning of my experiment as my results told me that there were more species available towards the tree, which then decreased as I went away from the tree.
The green chlorophyll in the leave uses sunlight to change the carbon dioxide gas and water into food (photosynthesis).
Light affects the rate of transpiration because the size of the stomata opening is controlled by light. As the stomata open in the morning, the rate of transpiration increases, decreasing at night when the stomata close.
So most of a plants water loss occurs during transpiration as water vapour diffuses out through stomata on the leaves. This also occurred in my experiment. One of the factors that affected my experiment was light.
Within an ecosystem, Heterotrophic organisms are the consumers in food chains. Green plants, known as the primary producers, are autotrophic and able to synthesise the organic molecules, which are required by consumers. Primary consumers are herbivores, feeding directly on green plants. Secondary consumers are carnivores and feed on the herbivores. Tertiary consumers are also carnivores as they feed on the secondary consumers. Heterotrophic organisms that feed on both plant and animal material are known as omnivores.
As you can see if there are no primary producers the whole food chain breaks which results in less animals so the green plant are vital to the herbivores in order to keep the food chain continued.
So overall energy from the sun enters an ecosystem through organic compounds produced, in photosynthesis, by green plants.
Analysis/Conclusion:
By looking at my graph I have noticed a pattern, which is as the distance increases the number of species present decreases.
This is because, of the competition of water and light available to the plant.
There is not enough food available for plants to develop on, which results in a reduction of plant species and also the plants are being trampled on in an open area, which is also an issue as the plants won’t be able to grow when the plant is being ruined. As the green plants are the primary producers they provide food for the primary consumers who are known as the herbivores who feed directly on green plants. This causes a decrease in plant species present.
By looking at the graph I see that the number of species at first remains constant for the first two points, which then drops to the next point it, then goes up by two more species and then towards the middle it completely decreases gradually.
I have drawn error bars on my line graph to show where the values could have been if I did the experiment again which also shows a similar pattern from the original results that were obtained.
I have recognised one anomaly, which occurs during the third average. This anomaly is out of line with the rest of the averages this inconsistency, is decreasing but then rises again afterwards. This is due to the light available there as the soil did not get enough so it did not produce enough food and less water was also available which resulted in less species present at that particular spot.
By looking at my results table of all the averages I see that the light intensity is steady at first, which then increases at towards the last point it drops completely.
I also noticed that the soil pH was neutral so this was not a factor, which affected my investigation.
Overall I realised that the light affected my results. As where there was less light available there were less species present and where there was more light available there were more species present.
My hypothesis was correct, as I had said ‘As the distance from the tree increases the species richness decreases’. You can see I was correct by looking at my graph and the results I had produced on the averages table.
Evaluation:
My results show that as the species richness increases the distance decreases.
I had faced a few problems with some of the equipment such as the light metre and pH meter as I have described earlier on, but if I had extra time I would try and get used to the equipment and to see whether I could use it accurately in order for me to go ahead with my experiment and to produce reliable results.
I would have tried to handle the apparatus correctly by having some trial runs on all the equipment being used as this may have affected my results.
From the actual results I obtained I am fairly happy with them because they matched my hypotheses that was tested and expected. Most of my data was reliable as I only resulted in one anomaly where as if I had unreliable data I would have produced many more anomalies. From my summary of results and my graph there is a pattern including with the error bars.
I think that overall my method and techniques were correct and I did not write up any poor steps in my method and this did not affect my results. If I had more time for my investigation I would have repeated the experiment at least once more all the way around the tree four times so that I would definitely have more accurate and reliable recordings. So that I could expand on my investigation and have more to write about because I would have more comparisons to be make and more key differences to identify.
I would also make sure that my quadrat’s distances were equal to one meter apart from each other so that again my results would be more reliable, and that no anomalies would occur unless it had something to do with nature. I would have also made sure that my soil pin was used correctly as I may have pushed it down into the soil with a little extra force or I may have done the whole thing incorrectly. So with the extra time could have repeated the soil pin test again and got the correct measurements.
I would also re-do the light intensity and pH meter tests again to obtain trustworthy results because I would have more time to do the tests instead of rushing myself against time to speed up the process. If I were to the whole investigation again I would repeat the whole experiment again but on a different area on the field, and also on a different cedar tree to see if I obtain similar results.
I would improve my investigation by not making it very time consuming and doing everything correctly to satisfy myself and to make sure I get precise results
I have learnt many new things through this investigation for my own knowledge such as how to use a pH meter, light meter also how my hypothesis was correct.