My controlled variable are going to be the Mass of the trolley, Friction and the Distance the trolley has to travel.
Prediction:
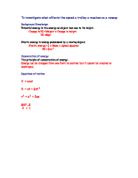
When the height of the runway is increased I think the speed of the travelling trolley will also increase.
I think this will happen because when the height of the runway is increased the trolley gains more potential energy therefore giving it an increase of kinetic energy as it moves down the runway. This is shown in the diagram below.
Height PE
PE KE
KE
We are going to use the conservation of energy law
PE KE
mgh = ½mv²
v² = 2gh
Method:
Apparatus: Runway Trolley Books
Light gate Card Easy sense + computer
Diagram of experiment set up:
Starting point
Trolley with card on top
Text books Runway Light gate connected to the computer which has the easy sense program running.
Instructions
Set up apparatus as shown above
Turn on the computer
Clamp light gate to the edge of the runway and turn on the easy sense unit.
Start easy sense by going to Start, Programs, Easy Sense then Timing on the computer.
Change the settings so that the computer is measuring velocity.
Set up a table in Easy sense timing for measuring your results.
Set the car at the start point and release.
The computer works out the velocity of the travelling trolley and inserts the results into the table.
Repeat this three times to make sure the results are reliable.
To change the Height variable we add an extra text book under the runway after each set of results has been recoreded.
You need someone to stand at the end of the runway to catch the trolley as could hurt someone if it falls off the edge.
To measure what height the trolley is travelling down we will subtract the height at the bottom of the trolley from the height at the top of the trolley. At its maximum height the trolley will be on top of twenty text books.
Results:
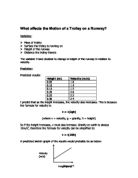
Below is a results table I will use.
Increase
in
Speed
Increase in Height
I expect a results graph to look something like the sample one above
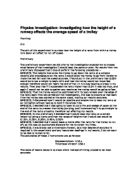
The graph which we obtained from carrying out our experiment show us that with a increase of runway heights comes an increase of velocity at which the trolley travels.
Conclusion
The only trends or patterns that I found from my results was that the velocity increased in an almost steady pattern when there was an increase of height.
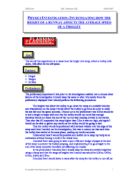
The graph below is just another graph I made myself showing the height of the runway against velocity squared
Explanation
My conclusion proved my prediction correct as I thought velocity would increase with an increase in height. This happened because as the runway is raised to a greater height the trolley gains more potential energy therefore giving it greater kinetic energy so it travels at a higher velocity.
Evaluation
I think the method used when carrying out our experiment was the best available because it involved us repeating the measurements three times for each height giving us very reliable results.
There was one result that was at a higher velocity and broke the trend.
I think this might have happened because it might have been accidentally given a push at the top of the runway giving it more PE.
I think the only improvement we could make to the experiment is when releasing the trolley at the top. You could maybe have a barrier which can be raised ti release the car so that it isn’t given any extra force.