To measure the rate of photosynthesis in a simple plant such as pondweed, it can be placed within a beaker immersed in water, while a light bulb is shone onto it.
Science Modular Biology Coursework 1 - Rate of photosynthesis
The purpose of this investigation is to investigate the factors which affect the rate of photosynthesis in a plant. I will be conducting various experiments to test my prediction. The basics of photosynthesis involve the plant absorbing sunlight and water, and generating energy.
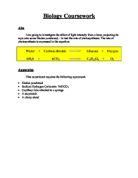
Photosynthesis is a chemical reaction that takes place in the chloroplasts in green plant cells, where light energy is used to convert carbon dioxide and water to glucose and oxygen. The symbol equation for this is: ''CO2 + H2O'' becomes ''C6H12O6+O2''
The sunlight is absorbed into the leaves. The cells within contain chloroplasts, which hold a green pigment called chlorophyll, which is used to combine carbon dioxide and water to produce glucose. The chlorophyll within the chloroplasts also ensures that the green light from the spectrum of light the sun produces is reflected - not absorbed. By doing this and absorbing red and blue light, the leaves appear green. The roots intake water and minerals from the soil they are planted in, and the leaf absorbs carbon dioxide. Chlorophyll absorbs the energy from sunlight which allows water and carbon dioxide to combine and perform a chemical reaction to create glucose. A waste product of this process is oxygen. The formula for the process of photosynthesis is Carbon dioxide + water and sunlight becomes glucose + oxygen.
To measure the rate of photosynthesis in a simple plant such as pondweed, it can be placed within a beaker immersed in water, while a light bulb is shone onto it. In addition, a gas syringe can be connected to the beaker to collect the oxygen released as the by product of photosynthesis. When the bulb shines onto the plant, the reaction will take place from the energy within the light. The reaction releases bubbles of oxygen into the water, showing a chemical reaction has taken place. The syringe will collect the oxygen which was released, and that can be measured to determine the rate at which the plant photosynthesised.
The rate at which photosynthesis takes place depend on three limiting factors:
* The amount of light available
When the light intensity increases, the rate of photosynthesis will also increase, so they will be directly proportional to each other. This, however, will only continue up until a certain point, where the rate of photosynthesis will not increase further whether or not the light intensity carries on increasing. This shows that the amount of available light will no longer be the limiting factor, and that there is another of the three factors preventing the rate from increasing.
* The amount of carbon dioxide available
The rate of photosynthesis may also increase with the amount of carbon dioxide to an extent at which they may be directly proportional, provided that any of the other limiting factors aren't restricting the rate. As the carbon dioxide increases, the rate of photosynthesis increases, however, it halts at a certain point, which again, shows that carbon dioxide is no longer the limiting factor, and that either the temperature is not optimal or the light available to the plant is insufficient.
* The environmental temperature
The temperature of ...
This is a preview of the whole essay
* The amount of carbon dioxide available
The rate of photosynthesis may also increase with the amount of carbon dioxide to an extent at which they may be directly proportional, provided that any of the other limiting factors aren't restricting the rate. As the carbon dioxide increases, the rate of photosynthesis increases, however, it halts at a certain point, which again, shows that carbon dioxide is no longer the limiting factor, and that either the temperature is not optimal or the light available to the plant is insufficient.
* The environmental temperature
The temperature of the plant's environment affects the plant's rate in a unique way. For instance, as temperature increases, the rate increases, however, when the temperature exceeds 45 degrees Celsius, the rate suddenly falls to zero. This shows that the chlorophyll is similar to an enzyme - in the way that the conditions they can work in have to be met exactly for their function to be carried out effectively. The chlorophyll can only work under warm conditions. When the temperature exceeds the recommended amount, the chlorophyll is destroyed, hence the rate drops to zero. Despite that, the temperature can only be the limiting factor when it is too low.
To summarise all of the above, the key factors of photosynthesis are the light intensity, the amount of carbon dioxide, and the temperature the plant is exposed to.
I predict that the speed of photosynthesis will increase and become faster when the lamp is moved closer towards the plant.
I think this because the limiting factors have a dramatic effect on the rate of photosynthesis. The intensity of light will allow the plant to have more energy from the sunlight, thus enabling it to photosynthesise quicker, however, if the limiting factor were to become something other than the light intensity, the rate would not increase any more after a certain point.
I predict that the line graph from the result table will look similar to the one below:
This would match with my prediction and prove it correct.
When the lamp is moved closer, the light becomes more concentrated on the plant, and this would mean the plant has more energy to use to cause a reaction between the carbon dioxide and water. This would also ensure that the limiting factor would not be the amount of light any more if the rate of photosynthesis happens to remain at a certain speed.
When the lamp is moved further away from the plant, the energy the plant intakes from the light is restricted, causing the rate of photosynthesis to decrease. This would effectively make the amount of light the limiting factor.
I am going to test the light intensity by varying the distance between the lamp and the plant.
The key factors involved in this investigation involve the rate at which oxygen bubbles are released by the plant when the distance between the lamp and the plant is changed. I will keep the plant and the lamp the same during the experiment, and I will change the water for every plant, while varying the distance between the lamp and the plant. In addition, the time which the plant is exposed to the light will remain same throughout. I will also be monitoring the rate at which bubbles appear in the water, and I will measure the volume of oxygen captured in the gas syringe to determine the rate of photosynthesis.
First, I will be carrying out a preliminary test for the purpose of defining what I will need to improve for the main test in my investigation. I will now display a table of the results I received:
Distance: (cm) Volume of oxygen: (mm3)
0 4.9
20 3.8
30 4.8
40 3.4
50 1.6
By evaluating the above table, I can tell that my methods of displaying the results need to be improved as I have noticed a major anomaly present. On a more serious note, I can render my prediction correct for the time being, as the table's results correlate with what I stated would happen. In order to minimise anomalies with major threats to the investigation, I will improve the result table by taking more than one reading for each distance. This will enable me to calculate the average rate at which the plants photosynthesise, thus substantially reducing the chance of anomalies being present. Otherwise, the distances seem to be correct, so i will be using the same distances in my investigation.
To begin the test, I will place ten centimetres of pondweed into a beaker, and submerge it into another beaker which will be full of water. The beakers must be transparent. I will then connect the submerged beaker to a gas syringe, which will be held above it. I will then introduce the lamp, and begin allowing the pondweed to have exposure to the lamp's light. I will allow the plant to have continuous exposure for five minutes at each distance. Having said that, I will not start the readings until three minutes have passed, to allow the plant some time to adjust itself. After this, I will move the lamp to a further distance and conduct the experiment again.
The equipment will be set up to match the diagram below:
The distances I will use for the lamp are 10cm, 20cm, 30cm, 40cm and 50cm.
When I have concluded recording the results, I will repeat the test at least once and calculate the average volume of gas, which will give me an accurate result.
I will now record and display the results from the experiment in a table. The table shows three readings for each length and provides an average value.
Using the results from the table, I will now plot a line graph to help me find out the correlation between the distance from the light source, and the rate of photosynthesis. In addition, I will also draw a curve of best fit so I can retrieve an approximate value without repeating the whole experiment. The graph will aid me in proving my prediction right or wrong.
The graph has been attached as appendix ''A''.
The attached graph shows that there is negative correlation between the distance and the volume of oxygen found in the plant. This means that when the distance increases, the rate of photosynthesis decreases. My prediction states exactly that, and this graph provides sufficient evidence for me to render my prediction correct. Evidence from the graph proves that when the distance was 10cm, the volume of oxygen was 4.8mm3, and when the distance was increased by 20cm to just 30cm, the volume decreased substantially to become 2.9mm3.
At the same time, when the distance was changed from 50cm to 10cm, the volume of oxygen changed to prove my prediction right. It became 4.8mm3 from 1.7mm3. This shows that as the distance between the light source and plant decreases, the rate of photosynthesis increases. This occurs because the light (being closer to the plant) is projected in a more concentrated manner, and the plant will be exposed to a beam of light with high concentration of light energy, allowing more chlorophyll to be exposed to sunlight, which will enable it to react and produce glucose and oxygen more.
If, however, the distance was higher, the energy from the light source would be less concentrated and would take longer to reach the plant, making the plant's rate slow down.
As this investigation draws to a conclusion, I can safely say that everything went as anticipated. Naturally, I am pleased with my results as they successfully proved that my prediction was correct. The farthest distance, as expected, caused the plant to have less volume of oxygen within it than it would have had at a closer distance.
I am pleased with my decision to attach the apparatus to a clamp, as it is more stable than a person. I am also happy with my decision to repeat the experiment three times, as it proved very helpful in eliminating all anomalies.
There were in fact no major aspects which came remotely close to jeapardising the investigation. Everything progressed smoothly.
I could point out anomalies easily using my line graph, as any point which is far from the curve of best fit has a high chance of being an anomaly.
To improve the experiment the next time I decide I wish to test how the distance from a light source affects the rate of photosynthesis, I will use an increased length of pondweed, and perhaps take more readings and repeat the experiment more times in order to completely wipe out anomalies.
I concur by confirming that my hypothesis was proved correct effortlessly.
Alexander Karapetian