Method:
STEP 1: First we had to boil the kettle then we will insulate the can (silver tin) with bubble wrap.
STEP 2: We will then insert hot water into the can (we are using in metal can because metal conducts heat and it will test the insulation more). We will also put a lid on to keep in more heat.
STEP 3: In the lid we will insert a hole to put the thermometer in so we can see the temperature.
STEP 4: We will test the tin on its own with the lid for 10 minutes and record what temperature it is on each minutes. The amount of water we put in will be 300 ml.
STEP 5: We will do the same experiment with new water and add another layer of bubble wrap and take the temperature at each minute.
STEP 6: We will do exactly the same as above for 2 layers of bubblewrap then 3 layers of bubble wrap.
STEP 7: For a control we may put a can with no insulation (we will have a lid) and compare it to the other results.
STEP 8: Our starting temperature for the water is going to be 85˚C
Results:
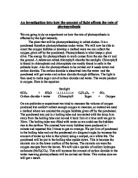
No Layers Of Bubble Wrap
1 Layer Of Bubble Wrap
2 Layers Of Bubble Wrap
3 Layers Of Bubble Wrap
Graph is on loose piece of paper
Conclusion: My graph shows that the more layers of bubble wrap, the better the insulation. This is because the bubble wrap has pockets of air and heat can’t travel very fast through gases because the molecules have to hit each other to pass on the heat.
Evaluation: I know my results were accurate because we put in the exact amount of water every time we did the experiment, this is because the more water you have it will slow down slower and the less water you have the fast the temperature will go down. We also did each experiment twice and worked out an average for each minute. We also made sure at the beginning that the water was always 85˚C at the beginning of every experiment; this is because high temperatures will loss heat quicker and low temperatures will loss heat slower. We also cooled down the tin before each experiment.
I am sure about my conclusion because on the graph the blue line (which indicates the controlled experiment) goes down a lot quicker than the red line (the 3 layers of bubble wrap). The results for the 3 layers of bubble wrap have a range of 5˚C, the experiment of 2 layers has a range of 6.25˚C, the experiment with 1 layer has a range of 6.5˚C and the controlled experiment has a range of 13˚C so this supports my conclusion.
I could improve the experiment by done more repeats because the more repeats you do the more likely you are to get a more accurate result for your average. I could of also tried more experiment for example with 4 or 5 layers of bubble wrap. This could of given me a broader look at results. I could of also timed the experiment for longer to get more results and a broader look at the averages.