Plan
- Collect two ranges of data sets; the sets must consist of more than 10 data values.
- The data were collected totally randomly not deliberately picked.
- The data were put into a table.
- Check the distribution in a bell curve.
- The data were plotted in a histogram.
- The mean were calculated using a ti 84plus graphics calculator.
- The standard deviation will then be calculated
- Repeat all the steps for the second set of results.
- Then I will compare the results using the student t-test and then I will be able to form a conclusion from there.
Variables
Independent
The type of population the data was collected from. In this case it was the length of leaves collected from two different populations of fern plants.
Dependent.
The measurement of size collected from the independent.
Controlled
The controlled variable would be the type of plant selected.
Method
The plan written above was used as the method
Results
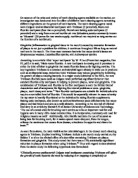
The results have been recorded and placed into tables and graphs below.
*In the graph the length is measured in cm.
Automatically we can see that there is a large difference between the plants grown with sun to those without sun, so I can conclude that my hypothesis was correct.
For the t-test I received two different answers, I am using the calculator answer as it seems to make more sense than the answer that was retrieved from the program “Microsoft Excel”.
The trends we can see is that in the middle of the graph, at 6 of the numbered of leaves measured, there are two other leaves which seem to be about the same length. The lowest and highest leaves seem to also have the same amount of difference in length comparing them to the mean.
In the degrees of freedom chart this value is closest to 8.61, so the probability that chance alone could produce a difference is 0.1%, this is a good result to have as this means the results collected are very accurate.
Conclusion
I can conclude that the experiment in general went well. It was a shame though that Microsoft© hasn’t fully developed it’s student office programs to calculate and easily make graphs and other sums in the Mac©.
On the other hand I am happy that I could do most of the work and finish the rest of the calculations, like the student t test, which showed that there was very little chance of the difference in the lengths between the two sets of data being caused by chance alone.
Due to the complicated measures and limitations of the same program as before I could not create a bell curved graph to represent the standard deviation but I can conclude that they were pretty significant.
Evaluation
I thought that the experiment was completed safely and carefully as all the results taken down also included decimals to increase the accuracy.
To improve this experiment I think it would be better to grow plants in the laboratory where the conditions would be the same, but one would be in darkness and one would be at a window, both would be watered the same amount too.