Prediction and Reasoning
If testing the H O in the range 0-20%, I predict that the optimum concentration of the H O for catalase will be at 20%. As the concentration of H O is weakened by half (10% H O ) the amount of oxygen produced in the fixed time will also be halved. This is because the more H O particles available the more substrate there is for the enzymes to break down, therefore producing a greater amount of oxygen at a quicker rate and visa versa. The less H O particles available the less substrate there is for the enzymes to break down, therefore producing a smaller amount of oxygen at a slower rate. In general, as the H O concentration increases the amount of oxygen produced will also increase, at a proportional rate.
Pilot Test
I conducted a Pilot Test as part of my preliminary experiment. This will give a guideline to the approximate results that could be expected and to also discover which size potato chip, volume of H O and apparatus would be best to use in my experiment. From this preliminary I discovered that a suitable size for the potato was width size 6 and length 3cm, and an appropriate volume of H O was 25ml. This pilot test also allowed me to discover that with more curves in the delivery tube, the chance of getting an air bubble blocking the escape of oxygen was also higher. In my method I plan to use a delivery tube with the least number of curves as possible to prevent any air bubbles that might develop from ruining the results.
Method
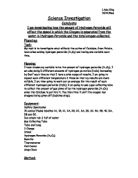
- Set up the apparatus for the experiment as shown in the diagram. Ensure the experiment is a fair test by keeping all the variables constant (as described above) apart form the H O concentrations.
- Add a potato chip to the boiling tube of 20% hydrogen peroxide solution (H O ) and replace the bung. Wait two seconds before starting the timer, to prevent time inaccuracies and to also avoid counting the initial bubbles that are given off as the reaction begins, which will cause anomalies in the results. Only experiment within the range of 0% - 20% H O . This is for safety purposes and to also allow accuracy in conducting the experiment. Using H O of 100% concentration will produce oxygen bubbles to quickly to count.
- Count the number of bubbles produce in 2 minutes and record results in a table.
- Repeat the experiment twice more with the same concentration and calculate an average from the three sets of data for this concentration.
- Then repeat the experiment with the other concentrations of H O three times and calculate the averages. Use the measurements of hydrogen peroxide and water below to produce each concentration ~
20% concentration – 25ml H O
18% concentration – 22.5ml H O + 2.5ml H O
15% concentration – 18.75ml H O + 6.25ml H O
10% concentration – 12.5ml H O + 12.5ml H O
5% concentration – 6.25ml H O + 18.75ml H O
0% concentration – 0ml H O + 25ml H O
- Plot the average and individual results onto two graphs.
Results Table
Analysis of Results - Graphs
Conclusion
My results show me that the higher the concentration of the substrate (H2O2,) the more oxygen bubbles produced in two minutes. The 20% H2O2 concentration produced the most O2 bubbles (98 bubbles) in the fixed time. This is because there were a greater number of acid particles to collide with the enzyme particles, creating more successful collisions. More frequent collisions give a higher reaction rate, therefore producing the most oxygen. The least amount of oxygen produced in two minutes was 0 bubbles, at 0% concentration. There were no acid particles to collide with enzyme particles, therefore creating no successful reactions. No collisions meant there were no reactions, subsequently not producing any oxygen.
The first graph drawn, with the average number of oxygen bubbles produced in two minutes plotted against H2O2 concentration, shows that the relationship can be drawn in a smooth curve. As one increases, so does the other. The average of the results of the three trials shows that the concentration is not directly proportional to the number of oxygen bubbles produced. The graph looks like the beginning of a parabolic curve. It has steep gradient from 0-10% H2O2 concentration, but after this, from 10-20% concentration the line trails off to a shallower slope.
The range of results for each concentration within the trails also show the accuracy of the data. This can be seen on the second graph, where the results from the individual trails are plotted. With the 10% and 15% H2O2 the range of results was fairly small suggesting the data is very reliable. For the other concentrations, 5%, 18% and 20% H2O2 there are larger deviations from the trial averages (curves of best fit,) meaning there is a higher chance that these were the areas that most of my extreme anomalies can be found.
If I were to conduct the experiment again I would do so with concentrations up to 100% H2O2. I predict as the concentration increases so does the amount of oxygen produced in a fixed rate of time. I am not sure whether the amount of oxygen will continue to increase until the concentration reaches its optimum and then remain steady or whether the amount of oxygen will increase to its optimum concentration and then fall due to the fact that the enzymes become denatured. If the tests were repeated and averages were collected, I could discover which of these two graphs the results agree with.
In general, my results partly agree with my prediction. I predicted that the optimum concentration of the H2O2 for catalase would be 20%, and from my results I can see this is correct. However, the other half of my prediction was false. I predicted that the relationship with the H2O2 concentration and oxygen bubbles produced would be directly proportional – that as the concentration of the H2O2 is weakened by half (e.g. 20% / 2 = 10%,) the amount of oxygen produced in the fixed time will also be halved. The results of the experiment show that this is not the case. For example at 20% H2O2 there were 98 oxygen bubbles, however at 10% there were 72. This clearly shows that the relationship is not directly proportional. (98/2 is not 72.)
Evaluation
On the whole, most of my results were of moderately good quality, however there were also occasional results on my graph that appeared to be anomalies, which I have circled. Some of the results I got were not what I expected or predicted. This could be due to a series of reasons ~
- Human error ~ miscounting the bubbles of oxygen could be the reason some of the results were incorrect. This can be rectified by double-checking the number of bubbles using two people, improving the accuracy.
- Oxygen bubbles of different sizes ~ during the experiment I found that the bubbles of oxygen were of different sizes. Counting the number of bubbles of different sizes is not very accurate for this investigation. Measuring how long it takes for a fixed volume of oxygen to be produced would have been a more suitable method. However, it would also have been harder to carry out and the results could possibly be just as inaccurate, due to large air bubbles in the measuring cylinder used to measure the volume of oxygen.
- Experiment conducted on two different days ~ this could have a result on the equipment used. On one of the two days the apparatus could have been faulty which in turn would have affected the data dramatically. A different potato was also used on both days. One could have contained more catalase than the other, due to its age or potato type, making the results inaccurate. To improve the reliability of the results in future I would use potato chips from the same potato and ensure I used the same apparatus.
-
Inaccurate measurements ~ the concentration measurements of H2O2 were not as accurate as they could have been. This was due to the awkward measurements such as 18.75ml H2O2 and 6.25ml H2O. These 0.25ml measurements are inaccurate to measure. The investigation would have been easier to conduct if the measurements had been simpler, for example using a total 20ml solution rather than 25ml, giving whole number H2O2 and H2O measurements.
- Unwanted bubbles ~ oxygen bubbles from the previous experiment were left trapped in the apparatus, and were sometimes included in the counting of bubbles in the current test when they came out. In future experiments, this can be overcome by blowing through the delivery tube before using it as apparatus in a test.
The procedure I used was not as accurate as it could have been, due to the reasons explain above. Although the results were reliable, they were not very accurate. My method could be improved by counting the amount of oxygen bubbles given off in the reaction each minute, for 10 minutes, with each concentration. This would allow me to accurately calculate the rate of reaction each minute for each concentration. Another method would be to conduct the reaction on a mass balance, measuring the mass loss (oxygen given off.) I could then repeat the experiment again, to calculate averages and therefore get more reliable results.
I am not very confident that my conclusion is correct because it was made using results that contained many anomalies. There is not sufficient valid evidence to support any assumptions or approximations I made in my conclusion.
The experiment could be furthered and improved by testing concentrations up to 100% H2O2 or by using a computer as a source of reliable and accurate measuring, possibly the data logger, especially fro the mass loss experiment. In addition, repeating the experiment more times for each concentration would also make the results more accurate when calculating the averages. This experiment could also be conducted by changing a different variable; still testing what effect is had on the amount of oxygen produced. Alternative variables could be changing the temperature of the H2O2, keeping the concentration and size of potato chip constant. The temperature could be changed using a water bath, and the oxygen bubbles could be counted within a fixed time, as before. Using a longer period of fixed time for each test would also make the data collected more reliable and valid. Another variable could be the size of the potato chip itself. The experiment could investigate what effect the amount of catalase has on the amount of oxygen produced. The temperature and concentration could be kept constant by conducting the experiments at room temperature and only using one concentration e.g. 20% H2O2.