Experiment 1 (half and half): 22.15 seconds
Experiment 2 (half thio, quarter acid): 53.99 seconds
Experiment 3 (quarter acid, half thio): 23.86 seconds
This simple test shows that the concentration of acid did not affect the speed of the reaction, while lowering the concentration of thiosulphate more than doubled it.
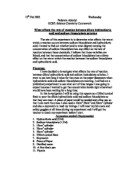
As I know that there a set number of particles in a given volume of thiosulphate, it is safe to assume that halving the concentration will halve the number of successful collisions. This in turn will double the rate of reaction (as the collisions will be occurring only half as frequently). This is shown in the diagram below:
In A, there are 10 particles. In B, the same volume of thiosulphate has been diluted with an equal amount of water. This means that there are only 5 particles (i.e. half as many) in the same volume.
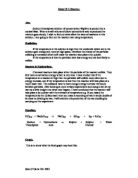
This quantitative prediction is supported by a preliminary experiment I conducted. In this experiment, I used H2O to dilute 50ml of thiosulphate in units of 10ml. That is, I started with 50ml of thiosulphate, then 40ml and 10ml of water, followed by 30ml of thiosulphate and 20ml of water etc. until I could dilute no more. The results, graphed and recorded below, show that the speed doubles when the concentration is halved. The results are not precise as I used beakers and conical flasks over burettes and pipettes to measure the amounts.
This graph clearly demonstrates the reasoning behind my quantitative prediction. Also, it shows that rate of reaction can be calculated as 1/t(s). This is a useful comparative figure, as all results are shown between 0.0 and 1.0
Plan:
As with the preliminary experiment above, I shall begin with 50ml of sodium thiosulphate mixed with 5ml of hydrochloric acid, then dilute the thiosulphate with 10ml more water each time. As soon as I poured the acid into the thiosulphate, the timer will begin. Under the conical flask in which the mixture will react will be a piece of paper with a large, bold X on it. When I am no longer able to see any trace of this mark, the timer will be stopped.
To measure the volumes of thiosulphate, I shall use a burette marked in 1ml increments (up to 50ml, since this is the most I’ll need for one experiment). This will provide the greatest accuracy, and ensure that my results are absolutely precise. I shall use an identical; yet separate (to prevent any unwanted dilution of the thiosulphate), to measure the volumes of water. To measure out the acid, I shall use a 5ml pipette, which will allow me to ensure that an identical amount is used for every experiment.
Diagram and Method of Experiment:
- Measure out the amounts of thiosulphate and water necessary for this test. Pour together into a conical flask, gently shaking to ensure that they are wholly mixed.
- Measure 5ml of hydrochloric acid in the pipette.
- Squirt acid into conical flask and begin timer.
- Carefully observe the cross from directly above. As soon as it is completely obscured, stop the timer.
- Record the results, wash out the conical flask very thoroughly and repeat with the next concentration of thiosulphate.
The entire experiment will be repeated, which will allow me to spot any anomalous results. Also, should one experiment be totally wrong, this would leave me with at least some good results.
Fair Testing:
To keep the experiment fair, in each repetition, the amount of acid will remain constant. Also, all the equipment used will be the same (i.e. beakers, burettes etc.), as some instruments may vary slightly, but crucially, in size. I shall also be measuring the temperature at the beginning and end of the experiment because, as I have already mentioned, increases in temperature can speed up reactions. Finally, I will ensure that the conical flask is washed out thoroughly after each test – even a drop of acid will begin a reaction with the thiosulphate and potentially ruin the results.
Range of Readings:
The biggest reading will be for 0.150mol/dm3 sodium thiosulphate, and the smallest for 0.030mol/dm3. I have also decided to include a halfway reading, 7.075mol/dm3, as this will help me to determine whether my quantitative prediction was correct.
Number of Readings:
There will be six readings in all. In mol/dm3, these will be: 0.150, 0.120, 0.090, 0.075, 0.060 and 0.030.
Skill O – Obtaining My Results
To ensure safety, while conducting my experiment, I made sure to wear safety goggles and not to spill any of the chemicals.
While several results appeared anomalous, I repeated them as I went on (I plotted the graphs whilst testing) – the incorrect first results have been denoted in brackets after the correct ones.
Skill A – Analysing and Concluding
The graphs of concentration against rate of reaction – for both experiments 1 and 2 - have been included on a separate sheet; along with the graphs I plotted while conducting my experiment (which include the anomalous result from experiment 2).
Both graphs show a straight best line of fit, and a set of results with almost exact intervals. For the first experiment, the intervals between each result show are 0.08-0.09 in the rate of reaction, and for the second, 0.07. As I predicted, the graph clearly shows that the 0.075mol/dm3 solution had a speed of almost exactly half that of the 0.15mol/dm3. As explained in my prediction, this is because halving the concentration has halved the number of particles able to react, and thus, logically, the number of successful collisions. This equal number of particles being removed or gained in a certain volume also explains the identical intervals that I mentioned, and allows the results to be used in other ways – e.g. if you were to triple the concentration, the rate of reaction would also triple.
This set of results can be very useful, as I can now predict, give or take, how long a reaction with any concentration of sodium thiosulphate will be – since both sets of results show the same line, slightly moved up the y-axis. Since I know that the gradient of the line for experiment 2 is 0.08 (i.e. for every 0.03mol/dm3 the concentration is increased, the rate of reaction increases by 0.08), these examples could be calculated most easily.
Skill E – Evaluation
Apart from the first result of the second experiment, there were no results that didn’t fit with the pattern. But why was this ? I believe that for this experiment, I did not wash out the conical flask holding the solution well enough before mixing all the chemicals and beginning timing; in fact, I could see the solution turning opaque, albeit slowly, before I began. As this result was obviously not correct, I decided to repeat it, and after having carefully cleaned the receptacle, I calculated a result with 0.041 rate of reaction. This second result was far more in keeping with the rest of the results, and the results for experiment one, so I decided to plot it (over the first).
Also, I believe that I know why the second set of results has an average of 0.01 (rate of reaction) greater than the first. As I explained in my plan, when the sodium thiosulphate reaction is heated, the particles gain more energy, thus speeding up and colliding more often. With more energy, more of the collisions are successful. Since the temperature of the room was 25° when conducting experiment 1, and 24° for experiment 2, the temperature must have caused the slowed reaction. Although I could have been incorrectly measuring the chemicals, that the change is identical for every time, and the temperature remained constant, probably means that the temperature was responsible for the change – not me.
Some results stray from the line of best fit by about 0.01 in rate of reaction. I can explain this, as washing out the conical flask left a tiny amount of water residing in it, even after drying it somewhat. This would lessen the concentration of the thiosulphate, and affect the speed of the reaction, although minutely.
That both sets of results concurred precisely with my prediction (and the findings from my preliminary experiments) shows that they are reliable. Since I was extremely careful while using the pipettes and burettes, and since these are virtually infallible instruments (along with the electronic timer), I believe that I did not conduct any part of the experiment incorrectly (barring the anomaly mentioned above). This proves that I have enough evidence to be sure my conclusion is valid, along with my prediction.
If I had the equipment available to me, I would prefer to set up an electronic measuring device. If the solution was to be placed on top of an LDR (light dependent resistor) embedded in a table, the accuracy of the results would be perfected – my eye was, although reliable, not exact, and the reaction time between seeing the cross disappear and stopping the timer would be removed. This could affect my results quite significantly, and it would be interesting to check whether my prediction was still true using this method.