2. Surface is another, obviously the ball will not bounce well on a soft carpet. This is because different surfaces absorb different amounts of energy, differentiating the height of the ball.
3. Different types of squash balls have different resilience (research4). If a ball has a higher resilience (can store a lot of energy under deformation) it can bounce higher (research2). Different balls show their resilience by the colour dot they have.
4. Temperature is another variable. As temperature increases the cross-links between the molecules weakens (research3), which means less energy is wasted in stretching the chains and molecules and breaking the cross-links. So that extra energy can be released as kinetic, thus making the bounce higher. In general as temperature increases so does the resilience.
5. Pressure is affected by temperature. As temperature increases so does the pressure. If the pressure is increased the height of the bounce increases.
From all these variables I have decided to investigate the effect of temperature. This will be my set variable. My measured variable will be the height of the bounce of a squash ball. I will keep all the other variables constant to make the test fair and these will be the controlled variables.
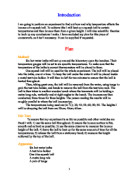
Prediction
I predict that as the temperature increases so will the height of the bounce. This is because it will weaken the cross-links (research3). I predict that the graph’s line will increase steadily, it may go back down slightly after a point.
Detailed plan
I have done a rough experiment to get the range of values I should use. Here are my results:
My results support my prediction. From this I decided that my final experiment will increase to temperature 80 ‘C, recording every 10’C, as it is not necessary to record every 5’C. I will drop the ball every time at 10m high to keep this variable constant. I will always use the desk as the surface. I will also use a yellow dot ball all the time. These are my controlled variables. I will also take into account:
- That if I hold the ball in my hand when I am about to drop it, I will adjust the temperature of the ball. So I will use tongs to hold the ball with.
- If I keep the ball out of the water for too long this will also adjust the temperature. So I will drop it as soon as I take it out of the water.
- After I drop the ball time after time the surface will change, as it will get wet. So I must dry the desk after I dropped the ball.
Diagram of apparatus
Method
- I will set the equipment as shown in the diagram. (The boiling water in the beaker should be at 80’C)
- I will leave the ball in the water for a minute at that temperature so that the ball will reach that temperature aswell.
- I will get the ball out of the beaker and hold it at the 1m mark, with tongs.
- I will then drop the ball while a friend will measure how high it bounced.
- I will dry the surface of the desk and put the ball back in the water
- I will record the results in a table.
- I will decrease the set variable by 10’C and repeat the experiment down to 0’C.
- I will repeat this process 3 times in order for me to calculate averages.
Results
Conclusion
My graph shows that as the temperature increases so does the height of the bounce (variable5), but after 60’C (in some experiments) the height of the bounce starts to decrease. The height of the bounce increases as temperature does because it is gaining more energy from heat than it is losing (also variable5), but it starts to decrease after 60’C, this maybe because it starts to lose more energy than it gains. This maybe because as heat weakens cross-links it may also start to be weakening the chained molecule bonds (research3). I cannot be sure of these reasons, I will have to research it in more depth. In whole my graph of the experiment does support my prediction that I predicted using the research I found.
Evaluation
My experiment was good but it wasn’t accurate or reliable enough. I found that my experiment was fairly reliable (when I looked at a graph with all the experiments on it) as all 4 lines were close together, but there were some very odd anomalies. On my average line I only had one anomaly at 70’C, which maybe due to many reasons. As for e.g.:
- I didn’t read the thermometer properly
- I didn’t read the ruler properly
- I left the ball out of the water for too long
- I didn’t hold the ball exactly at 1m
To improve this result I should:
- Drop the ball immediately from out the water
- Ask a friend to tell you whether you’re holding the ball at 1m
- To read the ruler exactly is hard unless you use a video camera and pause at the point and then read off, but I couldn’t have done that.
Most of my anomalies were at 70’C and 20’C. I cannot really explain this but maybe it was because I didn’t leave the ball to reach that temperature or some other fault from above. If I were to do this experiment again I would try and make it more accurate by:
- Using a video camera (above)
- Using a timer to time 1 minute (when I should leave the ball to reach that temperature
- Use many friends to help read out heights
But there would be no way to make this experiment be a lot more accurate.