Aim
My aim is to find the best insulator at keeping water at 500c, which will be the optimum temperature. I will make this possible by using two different types of materials having different colours and properties in each test; altogether I will do three tests. Each test will be done three times to ensure that I get the best results possible.
Prediction
I predict that by using different materials (insulators) wrapped around an Aluminium can. I will be able to see different rates of heat loss by the materials. I predict that the most successful at sustaining heat will be the non-metals. I predict that as time increases the temperature will decrease. I predict that the plastic lid and the wool around the metal can would be the best insulator because plastic is a commonly used material for insulating household utensils. I predict that the shiny surface of the plastic will decrease radiation by reflecting heat back allowing it to slow down heat loss. I predict that the wool would also help to decrease radiation by because of the internal air spaces, which will trap the heat. I predict that the second best insulator at keeping heat in would be the foil and white lid because the shiny white surface will decrease radiation by reflecting heat back allowing it to slow down heat loss. The worst insulator would be the cardboard and black lid because the structure of the cardboard is quite spaced out so them spaces will cause the heat escape quite easily.
Apparatus required carrying out experiment
- Measuring cylinder
-
Water (at 500c)
- Stop watch
- Thermometer
- Metal can
Materials
- Plastic lid and Wool
- Foil and white lid
- Black lid and Cardboard
Preliminary Work
In a sense preliminary work is an important as the actual experiment. It allows you to make a prediction before performing actual tests.
For my preliminary work I used 50cm2 of water, which was in an aluminium can at 50oC. Then I will use different paired materials to see which is the best insulator. My results will be recorded after a minute. I will repeat each experiment three times to make sure that my results are conclusive and my anomalous results are noticed easily. It will also allow me to find an average for my results.
Method
- Collect the metal can with thermometer. This will be the control, so it will have no material around to insulate any heat.
-
Heat water in the kettle to 500c, once heated, measure 50ml of water in measuring cylinder.
- Pour 50ml of water in metal can from the measuring cylinder.
- Wrap the metal can with the material required, which is going to be the plastic lid with wool covered around the metal can.
-
Once 50ml of water have been poured completely. Take temperature of water and make sure that the temperature is 500c if not make it 500c by cooling down the water. This will be your first reading from this moment timing will start.
- The experiment will last six minutes taking readings after each minute, which will give me six readings.
- Add results to table and then onto graph.
- Do same experiment another two times which adds up to three experiments for the paired materials. Follow steps 2-7.
- Done first experiment.
- Follow steps 1-8 but use different paired material, which is going to be foil and white lid.
- Done second experiment.
- Follow steps 1-8 but use different paired material, which is going to be black lid and cardboard.
- Done third experiment.
Whilst carrying out the experiment all safety regulations of the laboratory apply
Fair Test
To ensure the experiment is carried out fairly the following factors will be considered:
-
The temperature of the water will always be 500c when starting the experiment.
- Always measure the water to 50ml when starting experiment.
- Make sure record time after every minute in total six readings.
- Make sure each test is done three times and done at the same time so that there is not any difference in amount of material.
- Make sure same amount of material is used in each experiment.
- All tests will be done at room temperature.
Safe Test
To ensure that the experiment is safely carried out the following factors will be considered:
- Care will be taken when pouring water into measuring cylinder and metal can because it causes the skin to burn.
- The experiment will be done in the middle of the table because if it is done near the end it could fall.
Experiment Results
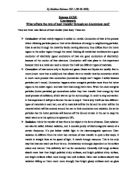
Above are the results from my first experiment using a plastic lid and wool wrapped around the aluminium can. I did three tests for the same material so that I could ensure I got the best possible results. After I had obtained my results I put them in the table and I put an average for the overall results. From the table I can see that as the time increases the temperature decreases this is due to convection, radiation and conduction.
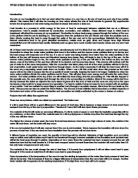
Above are the results table for my second experiment using a white lid and foil wrapped around the Aluminium can. I did the same experiment three times so that I could get the average. As you can see there is an anomalous result this may be due to misreading the thermometer or due to timing to long. The pattern is the same but the temperature decreases to a further extent.
As you can see the results are similar but it decreases to a further extent. I followed the same procedures as the last two experiments.
All my results were later interpreted on to graphs
Analysis of Results
From the results of my experiment I drew graphs to show what had been obtained from the experiment more clearly. The graphs clearly show that as the time increases the temperature decreases. The line of best fit runs through all three results, which were obtained. This shows that my results were valid but there was an exception on the second experiment I had an anomalous result this could have been due to misreading of the thermometer or timing too long. So I decided that I would get the two results, which I thought could not be out of proportion and got the average out of them two. The best insulators were the non-metals, as they are known in theory to be the best insulators. These are commonly used in house holds.
Conclusion
As I predicted the best insulator was the beaker with plastic lid and wool wrapped around it because as the heat was passing through the aluminium can (conduction) some of the heat was wasted and the wasted heat got trapped into the air spaces of the wool, this inevitably sustained the heat energy the longest. The graphs that I obtained initially help prove my prediction they show that as time increases temperature decreases. The plastic lid also helped in sustaining heat energy by its solid structure, this made the heated molecules to bounce off the plastic lid and stay in the aluminium can. As I predicted that the non-metals were the best insulators for instance the experiment conducted with a metal and a non- metal was decreased to the furthest extent to 38.50c. The other two experiments had a higher end temperature results than the second experiment. This is because in the second experiment I used a metal, which is not a good insulator of heat although it had a reflective cover (foil).
Evaluation
I think that the method I chose to obtain evidence was successful. The results are very consistent and accurate. There is one anomalous result. The anomalous result is the temperature of the second test of the second trial the temperature decreases to 300c, which I think it should be 400c. It does not fit with the other results. It is probably anomalous because of experimental or human error. It can be difficult to get conditions identical for every time we carry out the experiment, as identical conditions are essential for 100% accurate results. Accuracy is good, but it is very difficult to be completely accurate.
The procedure was suitable and I was able to obtain the evidence I needed and was able to come to a conclusion from them, however if I carried out the investigation again, I would use a different method. I would have timed for a longer time before stopping the stopwatch to verify the temperature. For instance in this investigation I timed for six minutes in total if I did the experiment again I would have timed for twelve minutes or more. This method would have produced more reliable results.
I think that my results are quite reliable. I think this is because they all. More or less, fit into a pattern and the line of best fit on the graph runs through nearly all the points. To make my results more reliable I could repeat the experiment more times. As the more times you repeat the experiment the more reliable they are. I could always measure accurately the amount of water, which I acquire. I could always set the water at the same temperature every time by a mechanism, which pours the water as soon as the water reaches the certain temperature. The last improvement that I would make is to clearly read the thermometer or else use a digital thermometer. These improvements will make the evidence more accurate and more reliable.
The evidence is sufficient to support a firm conclusion. I have plenty of evidence to support the conclusion and the evidence is mostly accurate. I can tell the evidence is generally accurate because the line of best fit on the graph runs through most pf the points. To extend this investigation I could use a plastic and investigate how plastic affects the heat loss. I could investigate how increasing the temperature of the water affects the heat loss. I could investigate how additional water affects the heat loss. Also I could investigate a wider range of materials affects the heat loss. These extra investigations would give me a much better conclusion, which had a lot more evidence to support it and that covered more factors that affect heat loss from a container.