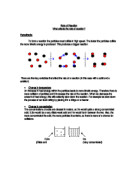
To tell us what actually affects the rate of reaction we will monitoring how fast carbon dioxide is given off. To find this out we will have a plastic basin containing water. A test tube measuring 10cc filled with water will be held upside down in the basin of water and a delivery tube will be attached to the beaker holding the acid and calcium carbonate and the other end will be positioned in the test tube in the water. We will use all the same apparatus to ensure everything is fairly tested and is accurate to the equipment we are using.
As the acid reacts with the calcium carbonate, carbon dioxide is released. This will travel through the delivery tube and into the test tube. The test tube will fill up with carbon dioxides and the water will pushed out. We will be timing this with a stop clock. As the water descends to 1cc we will record the time, then at 2cc, again at 3cc and so forth. At the end of each experiment we should have 10 times recorded. For each factor, instead of just performing the experiment once, we will repeat it three times to provide us with a more accurate end result. In total we will be doing 27 tests to show what effects the rate of reaction.
Diagram
To make certain that this method is good enough and to certify that it worked properly we will carried out a trail experiment. We used all the average variables for fair testing. So the temperature was at room (22°) the concentration not to strong or weak (1m) and the small marble chips.
Trial experiment results
1 molar room temperature small marble chips
The carbon dioxide was released very slowly in this test. It took over fourteen and a half minutes for it to finish and this would not be practical because of the limited time been given to conduct all our experiments. It took so long, because we had only put one small marble chip in. There were no more calcium carbonate particles to react with the acid particles, so this had a dramatic effect on the time. On In each test we do we will always place more particles than the amount we need, so there is excess calcium carbonate at the end to make sure it does not run out during the test.
Because this was the first time we were trying the tests out we were a bit slow placing the bung on and maybe some of the carbon dioxide had escaped. To improve our main experiments to achieve accurate results we had to place the bung on as soon as we dropped in the calcium carbonate to make sure no carbon dioxide escaped.
Results
Concentration
0.5 molar room temperature small marble chips
1molar room temperature small marble chips
2molar room temperature small marble chips
Particle size
Powder room temperature 1molar
Small marble chips room temperature 1molar
Large marble chips room temperature 1molar
Temperature
Room temperature 1molar small marble chips
30° 1molar small marble chips
40° 1molar small marble chips
Analysis
On the concentration graph the average of the 0.5m results was looked very different compared to the 1m and 2m averages. Because it took the longest time to reach 10cc of carbon dioxide, the gradient of the line of best fit sloped very gently. The release of carbon dioxide started off very slow at the being. It took 1:30 minutes to reach 1cc, then the rate quickened and in 2 minutes 5cc of carbon dioxide had been given off. On the graph the gradient in those two minutes steepened. The rate slowed down after that and the release of carbon dioxide was gradual and steady. The 1m and 2m results on the graph appeared very similar. Although the 2m results finished more rapid than 0.5m and 1m, the 1m was not far behind at all. On the graph the gradients of both lines were extremely steep compared to the 0.5m line. (Taking in account my x axis had to go up to 6 minutes for the 0.5m and 1m and 2m results both finished in under 1:10 minutes). In the 1m test the release of carbon dioxide was very stable. Apart from the first time recorded; which was 9 seconds, none of the other recorded times exceeded 5 seconds to give off 1cc of carbon dioxide at a time. The 2.0m results were less steady than this and actually took longer for it to finish than 1m. It did start off faster than 1.0m but then the rate reduced by the time it got to 4cc.
On the particle size graph each results for this were very distinct. The powdered calcium carbonate reaction was too fast for us to record and by the time it had released all 10cc of carbon dioxide the was 1 second. The gradient on the graph for this one was tremendously steep and was nearly just a vertical line. The small marble chips line on the graph is also quite steep and was stable too. The large marble chips line did not have a steep gradient. Like the 0.5m line the rate of reaction started of quite slow but then quickened its pace by the time it had released 3cc of carbon dioxide. This quickened rate was steady throughout the rest of the test. It took 2:16 minutes to release its 10cc of carbon dioxide.
On the temperature graph each line of best fit for the results on the three tests were similar. All three intersect nearly in the same place. The gradients are moderately steep and they all show a slight curve. This means they all started off slowly then the rate of reaction sped up, but then slowed down. The all also managed to release 10cc of carbon dioxide in less than 47 seconds. The test for temperature at 40° took the fastest time and the room temperature test was the slowest. The test at 40° started off fast taking only 8 seconds to release 1cc of carbon dioxide, then took 7 seconds to give off another 1cc. It then took 16 for it to release 5cc and the rate then stabilised. For every 1cc it released after that it took 3 seconds each time.
To conclude, the longest experiment took 5:27 minutes and that was the test for concentration with 2.0m and the fastest was the testing of particle size with the powered which was so fast, it only took 1 second. In the tests of concentration more dilute the acid was, the slower the speed of reaction was. (Apart from the 2m results which took slower than the 1m results). In the temperature experiments the cooler the acid was, the slower the rate was and in the particle size experiment the more surface area the calcium carbonate had the faster the rate of reaction. I can support this conclusion, because of the careful experiments we carried out to obtain evidence and the graphs and tables of results from the experiments we performed. My conclusion relates to my hypothesis as I roughly predicted that these would be my end results. Apart from the 2m test being slower than the 1m test, I predicted correctly. As I said that the changes of temperature would affect the rate of reaction the most (in time) the results for them were all under 47 seconds. In the particle size tests I predicted that the results would be very contrasting and evidence proves I predicted right.
Evaluation
The end results we obtained were fairly reliable; keeping in mind the resources we were given. There was a fair amount of evidence and results to come to a conclusion although I feel there could have been more experiments carried out to come to a more accurate conclusion. There was one test that did not follow the pattern of the other experiments and that was the concentration test of 2 molar. It should have been quicker than the 1m test but instead it was surprising slow.
There were not any other anomalies on the tests that I had come across apart from the 2 molar tests in concentration. This may have been because, the acid we used had been mixed up with the other acids or the one we used was not prepared properly. If I were to do these series of experiments again, then I would have given myself more time to do them so I could do more tries for each variable to attain more precise outcomes. For example, instead of just doing three tries for 2m in concentration, I would have done 6 or 7 tries, and then taken an average. I would have made certain that the acid I was using was equally and accurate in every experiment to ensure fair testing. I would have carried a large range of experiments to study each variable better. For instance, for temperature I could use more than just room, 30° and 40°. I could have done 25°, 35°, 50° even going cooler than room temperature, such as 10° and 15°. I could have also used a variety of sizes of the calcium carbonate and more than just three concentrations of acid.
I also would have carried out another type of experiment to back up the evidence I already have that the changes in temperature and concentration effect the rate of reaction. I would use sodium thio sulphate which is a liquid with hydrochloric acid. As the sodium thio sulphate reacts with the hydrochloric acid it becomes cloudy. So instead of measuring the carbon dioxide to confirm the rate of a reaction 1 would time how long it took for the hydrochloric acid to go cloudy.
To do this I would mark a paper with a cross and place it under a beaker. I would pour hydrochloric acid into this beaker (Making sure I used the same amount of acid in each experiment). At this point I would still be able to see the cross through the clear acid. As I poured in the sodium thio sulphate (Also making sure I used the same measurement of this in each test) I would start the stop clock and time the reaction until I could not see the cross on the paper. I would repeat this with 0.5m, 1m and 2m of hydrochloric acid and maybe heat it the acid like in the other tests to support my other evidence that shows what effects the rate of reaction. I would have predicted the same things for these experiments too.
All these changes and extra tests I have mentioned would have made my results more reliable, because there would be more accuracy involved. It would also give me a clearer idea on what affects the rate of reaction.