Of these variables, my experiment will be the thickness of the wire. The other variables (temperature, material and voltage) will have to be kept constant in the experiment to make sure that only thickness and resistance are investigated. The length will need to be kept constant to make sure only the variables indicated are investigated to ensure a fair test.
Prediction
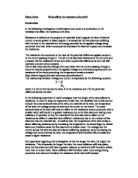
I predict that the thicker the wire, the lower the resistance. The thinner the wire is the less channels of electrons in the wire for current to flow, so the energy is not spread out as much, so the resistance will be higher, so if the wire is thicker, the resistance will be lower.
Equipment
Different wires with different thicknesses
Ammeter
Voltmeter
Power Pack
Micrometer
Crocodile Clips
Leads
Metre Stick
Variable Resistor
Method
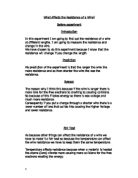
The equipment is set-up as shown in the diagram (See circuit diagram). The first wire is stretched and the positive crocodile clip is attached at 0cm and the negative at 50cm. The wire is then left on the circuit for 5 minutes to heat up. Once the wire is heated up, the variable resistor is adjusted so that the voltmeter reads 2V. For the experiment, the voltage will be kept the same, at 2V dc, from the power pack. The ammeter is then read, and the resistance recorded. The same procedure is carried out for the other pieces of wire.
Analysis
Results
Analysis of Results
The graph is an inversely proportional curve. This is because the resistance is directly proportional to the area of the wire. The reason for why it’s directly proportional is when you increase the area of the wire, the amount of ‘channels’ for the electrons to flow though increase. For example if you doubled the thickness of the wire, then you would be doubling the amount of ‘channels’ for the electrons to flow through. So, because more electrons are flowing, more energy is needed, increasing the current. Therefore, the resistance is lower.
Evaluation
The results from this experiment were not that accurate. This is because we didn’t choose enough pieces of wire to chose, and the micrometer differed quite a lot. If more pieces of wire were used, the results would have been more accurate because there would have been more results to compare it with. We could also have done with doing either a preliminary experiment or a second set of results, or maybe both. For the second set of results, different equipment would have needed to be used to make sure the apparatus we were using wasn’t faulty. As these results had a range of only 4 readings, and were not repeated, and that the results are not 100% accurate, then I would say that these results are not strong enough to base a firm conclusion on. This is because there are so many sources of error, which have been explained earlier.