Collision theory
The particles of reacting substances collide with each other and a fixed amount of energy called the activation energy (Ea) must be reached if the reaction is to take place.
------
If a collision between particles can produce sufficient energy a reaction will take place. Meaning only if they collide enough and in the right direction. Not an all collisions will results in a reaction.
- The more concentrated the reactants, the greater the rate of reaction will be. This is because increasing the concentration of the reactants increases the number of collisions between particles, therefore, increases the rate of reaction.
- The increase in temperature produces an increase in the rate of reaction. This because when a mixture is heated particles move faster and so according to the collision theory these moving particles will react, therefore increasing the rate of reaction.
- With a greater area there is more area for collisions to take place. This also increases the rate of reaction.
- There are also other things that affect the rate of a reaction. This includes:
- Pressure
- Light
- Catalysts
- But in this particular experiment these don’t have much impact.
Word equation
Magnesium + hydrochloric → Magnesium chloride + hydrogen
Acid
Mg (s) + 2HCl (aq) → MgCl (aq) + H (g)
Theory
When a metal reacts with an acid it releases a gas. This is because the acid usually includes a mixture of a gas and liquid. So when a metal is reactant with it combines with the liquid pushing and creating the gas to be released and at the same time increased. This is proven from the reaction of when Magnesium metal reacts with Hydrochloric Acid. When these to components meet they react to produce the gas Hydrogen. In this investigation I shall test and expectantly prove that this theory is true. The actual reason for the hydrogen to be produced is because Magnesium has two electrons in its outer shell. Hydrogen has just one electron overall and Chorine has seven electrons in its outer shell. When the reaction between the magnesium and the chorine and hydrogen which is together (Hydrochloric Acid) takes place, magnesium loses its two electrons to complete its outer shell. It gives one to chorine which completes chlorines outer shell and it gives one to hydrogen to give hydrogen two electrons which completes hydrogen first shell. This releases the hydrogen to be released and therefore to be produced by the magnesium while magnesium and chlorine combine to become magnesium chloride. This reaction is also effected by the molarity of the acid. The molarity of the acid is the in other word the concentration of the acid. It affects the speed of how fast the rate of a reaction is moving. The more concentrated the acid is the more faster the rate of reaction is because it allows the metal to combine with the acid more quickly for the gas in the acid to be released. This makes the rate of the reaction faster then the reaction with a less concentrated acid. This particular theory is the main motive for this investigation. From the experiment I will hopefully able to test and to hopefully prove that this particular theory is accurate.
Prediction
From the evidence of my theory I predict that the higher the molarity of the hydrochloric acid is the faster the reaction will take place. This is because the more molarity of an acid the more concentrated it is. The more concentrated the acid is the faster reaction rate will take place for the magnesium to react with the hydrochloric acid. So I predict that the more you increase a concentration of a reaction affects the rate of the reaction to increase.
So simply I predict that as the concentration of the solution increases, the faster(shorter) the rate of reaction will be. So as the molarity of the concentrations increases the shorter the length will be for the magnesium to dissolve.
I believe this because increasing the concentration of the reactants increases the number of collisions between particles, therefore, increases the rate of reaction.
I also predict that there will be a point where the concentration will be so high that the reaction will just explode.
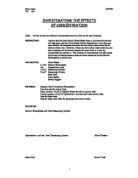
Risk assessment
I risk injury while using hydrochloric acid in this investigation. Hydrochloric acid is corrosive and can result in skin irritation and burns. I will try to minimise the risk by being extra careful when using it to make sure I do not spill any. I will also obviously wear goggles and a lab coat to protect myself and my clothes from the acid and any thing that may emerge from the reaction between the acid and magnesium. I will wear these throughout the experiment. I am purposely working in small proportion so that the reaction which is quite vigorous and possibly violent shouldn’t effect me considering the small proportionality.
Equipment
- Test tube
- Test tube rack
- Magnesium stripe of 1 cm
- Measuring cylinder
- Digital stop clock
- Hydrochloric acid of concentration-
- Mol (distilled water)
0.5 mol
1.0 mol
1.5 mol
2.0 mol
Diagram
Method
- Set up equipment as in diagram
- Review risk assessment
- Take and measure a Magnesium strip making sure it measures 1cm long
- Have your stopwatch ready and then drop your magnesium strip into one solution.
- With your stopwatch time how long it took for the hydrochloric acid to dissolve (disappear).
- Take note of this time ready to be imported into the following table:
- Then do the same with all the other test tubes with different concentrations.
- To identify when you are finished, you should have completed the table above.
Preliminary experiment
I will do a preliminary experiment to consider whether any aspects of the investigation need to be changed. This includes which concentrations of solutions to use and more importantly whether I have suitable time to complete the experiment. I need to verify how many times we can repeat the experiment to get accurate results and also whether the ranges for the variables are suitable for the whole of the investigation.
Preliminary experiment results
My preliminary results seem to outline that the lower the concentration the slower the rate of reaction, and so the higher the concentration the faster the rate of reaction. I followed my original diagram and method although there many changes needed to be made.
After the preliminary experiment
After the preliminary experiment I realised that some changes needed to be made. The concentrations below 1m are 0.00m and 0.5m. These concentrations are just not time effective. They are very slow. One presenting the rate of reaction at twenty minutes and one that virtually didn’t react and wasn’t worth waiting for. I have now made a decision to scrap and to remove these concentrations from my experiment. If include them it will be impossible for me to complete the experiment in a 1 hour time effective period. I simply cannot stay in the lab long enough to record results for those concentrations. So now I will simply look at concentrations from 1m to 2m. But unlike my preliminary experiment I will look into more detailed concentration. I will now look at concentrations of 1.25m and 1.75 m to the addition of the ones I have already looked at. The results in my preliminarily experiment seem very unreliable and simple. I need to repeat the experiment with each concentration at least three times to get concise and appropriate results. With three results I can easily find anomalous results and have more accurate results in the form of the averages. I am also generally happy with my method and the equipment used. However my method should be more detailed and instructive. I should include safety rules again as this is very important. I should also have a more detailed equipment list. I should of also explained the amount of hydrochloric acid needed to be used. I also believe I should review key factors, fair test and my variables one more time.
Key Factors
There are a lot of key factors that participate in this particular experiment.
Certain factors have to stay constant throughout the whole
experiment because they will help us find will accurate results.
The factors that have to stay the same are:
- Use the same size/scale of magnesium metal
- Use the same measurement/amount of hydrochloric acid
- Time all your results according to identical time scale for all your results
- Use the same equipment for all your results e.g. test tube, measuring cylinder etc
- Try to have the same room temperature throughout the process of your experiment.
The factors that need to be changed are:
Independent Variables: Change the concentration of the Hydrochloric acid every time you use a new piece of magnesium for a new set of results.
Other Key factors:
Independent Variables: The values I will use are:
- 25 ml of hydrochloric acid
- The different concentrations of hydrochloric acid that will be used are: 1m, 1.25, 1.5m, 1.75m, 2m (Molarity = m).
- I will time all my results according to the time scale of secounds
Independent Variables: Make sure that for the four concentrations of hydrochloric acid, that you have three timed results of each, of how long it takes magnesium to disappear when placed in it. It is important to have these amounts of results so that you have enough to plot a graph.
Dependent Variable: For your results you have to set out the three timed results of how long it takes magnesium metal to dissolve in hydrochloric acid. These three timed results have to be repeated and found for four different concentration of hydrochloric acid. It is also important to present the average of the three timed results of all four concentrations.
Revised equipment list
- Test tubes x 5
- Test tube rack
- Jar of ready made Magnesium stripe of 1 cm
- Measuring cylinder
- Digital stop clock
- Hydrochloric acid of concentration -
- Mol
1.25 mol
1.5 mol
1.75 mol
2.0 mol
- Sticker labels
- Ruler
- Lab coat
- Goggles
- Gloves
Improved Diagram
Fair Test
To keep this test/experiment fair I will have to keep the following variables the same:
- Use the same size/scale of magnesium metal so we can see what the hydrochloric acid does to it. When we do this with different concentrations of the acid we need the magnesium to be the same size so all the acid have had a fair turn to react with the metal.
- Use the same measurement/amount of hydrochloric acid so we are concentrating fully on what the concentration of the acid is doing and not the amount.
- Time all your results according to identical time scale so that the experiment results are fair and also easy to read.
- Use the same equipment for all your results e.g. test tube, measuring cylinder etc. This is so that all the equipment has a same effect on the experiment. Say we use a apparatus made of glass for one results and a apparatus made of cotton for the other. The cotton may absorb more heat and will ruin the whole test because it will not of been fair.
- Try to have the same room temperature throughout the process of your experiment. So that it doesn’t take an effect of changing any of the results. In order for temperature not take effect do the experiment in one go and find the results of each concentration one after the other so that temperature is unable to take effect.
Other things that may make the experiment unfair:
- Do not hold the magnesium in your hand to long because it may create heat and will make the magnesium dissolve quicker in the acid.
- Do not hold your hand over the test tube when magnesium is inside because it will conduct heat.
- When the experiment is taken place do not Shake move or do anything to damage or change the natural reaction of the metal and acid.
Method
- Set up the equipment as shown in the diagram
- Remember to securely place all test tubes securely onto the rack.
- Using your measuring cylinder measure equal amounts of hydrochloric acid and pour it into the test tubes.
- You should pour approximately of the hydrochloric acid solution into each test tube.
- Label each test tube with a sticker with the correct concentration (molarity) that it includes.
- Review risk assessment remembering safety rules and equipment.
- Take and measure a Magnesium strip making sure it measures 1cm long
- Have your stopwatch ready and then drop your magnesium strip into one solution.
- With your stopwatch time how long it took for the hydrochloric acid to dissolve (disappear).
- Then do the same with all the other test tubes with different concentrations.
- Then repeat the experiment two more times remembering to do this quickly, efficiently and remembering to wash and dry equipment each time.
- To identify when you are finished, you should have completed a table similar to the one below.
Results table
Bar graph – representing time taken for magnesium to dissolve in different concentrated solutions in three experiments
Analysis
I have used a wide range of concentrations ranging from 1.00 Molars to 2.00 Molars. In relation to my results table, the highest average reaction time took 110 seconds for magnesium to dissolve in 1 m concentrated hydrochloric acid. This compares to the quickest average reaction, which took 25 seconds for magnesium to dissolve in 2 m concentrated hydrochloric acid
My results tell me that the more concentrated the solution is, the quicker the rate of the reaction is. So vice versa the less concentrated the solution is the slower the rate of reaction is. This links to my prediction and proves that it is correct.
Looking at my bar graph you can se an overview of the results from the three experiments. You can notice how close all the results are . This shows a strong healthy consistency. This consistency presents the accuracy of my equipment. There doesn’t seem to be any odd results. This efficiency in results may be due to the routine of cleaning and drying equipment. It also may be due to the timing of the three experiments. All three was completed within the same hour, so they shared the same room temperature.
My line graphs are made up from the average results from the three experiments. The gradient on my first line graph remains very constant throughout. It shows a consistent increase in time. The line graph shows a smooth curve that can easily be presented with a line of best fit. This consistency again presents the accuracy of my equipment. There doesn’t seem to be any odd results.
If we look carefully at my line graph with the inclusion of the line of best fit, you can clearly see the consistent pattern. As the concentration increases on the x- axis you can clearly see the average reaction time increases too as shown as it goes up the y-axis. This again clearly links to my initial prediction to being correct, “as the concentration of the solution increases, the faster(shorter) the rate of reaction will be.”
As earlier stated earlier the more concentrated the reactants, the greater the rate of reaction will be. This is because increasing the concentration of the reactants increases the number of collisions between particles, therefore, increases the rate of reaction. My results undoubtedly agree with my original prediction and theory made before any results were taken. which stated: “As the concentration of the solution increases, the rate of reaction increases.”
My results prove this theory correct although the later part of my prediction needed to be questioned. The later part of my hypothesis stated that: “there will be a point where the concentration will be so high that the reaction will just explode”.
Theoretically from knowledge and background research this is correct although I wasn’t able to fully test this prediction as the change in time and speed was so minuscule; therefore it seemed that the rate of reaction would just get faster and faster with more concentrated solutions. With more efficient equipment and time and could of tested my prediction to a higher extent.
I believe that my results are reliable considering that all the points are close, if not on the line of best fit. On the results table, we see that all of the readings are fairly close to the average. There was no anomalous reading found during the experiment recorded on the table, So the actual graph was very accurate, the potential reasons for not getting this anomalous result are explained in the evaluation.
Evaluation
I believe the experiment was fundamentally easy to accomplish considering the limitations to equipment and more importantly time. It would always be useful to have more time to carry out experiments so that extra readings could be taken thus increasing the reliability of my results. Although for this experiment time wasn’t really a problem as all the results were taken before the end of the lesson. There was one problem we encountered which was to take readings from using the concentration (molarity) of reading under 1m. This could of made my results more accurate and allow me to overlook the conclusion of this experiment in a whole new way. However with my preliminary experiment it didn’t seem likely that these results would make major difference.
There were quite a few elements of my original plan that needed to be revised; after completing the preliminary experiment I created a revised method and an improved diagram (shown in the plan). I found I couldn’t use the concentration solutions of under 1 molar. This was mainly due to time, as I had to complete the experiment within the hour. I feel I made some sensible decision bringing in the 1.25 molar and 1.75 molar concentrations instead. This helped me to get the same amount of results but at the same time I was using time effectively. I also realised I needed to repeat the experiment to find averages for more accurate results. There were many other changes as described before, that made my experiment more accurate and efficient.
I believe I did take a sufficient amount of results in the short period we had to complete the experiment. Looking specifically at the graph I didn’t seem to see any missing gaps which therefore also leads to the range being suitable for the experiment. Although there is one potential gap which would probably be at the end, possibly, it would have been useful to have had another value for the input variable under 1 molar If it was possible to attain this concentration, my prediction would have been proved right even further.
I believe the results were accurate as they were all situated near, if not on the line of best fit. The results were also accurate taking into consideration that the concentration was to 2.d.p and my time results were to 1.d.p. Although initially one fault in the accuracy would have to be that the seconds was measured in detailed on the digital stopwatch to 3.d.p and I believe that it needed to be simplified. Although this could be changed as the scales we had available were to 3.d.p. The accuracy was also increased as we had average results from three experiments.
There was no anomalous result reported in my results table, My graph showed a good healthy consistency. There are a variety of reasons for why I had no anomalous reading:
- Had the same room temperature throughout
- Cleaned and dried equipment
- Something may have occurred to the solution such as a defect or a slight miscalculation of the volume of a solution.
- Human concentration and had good resources.
- Magnesium strip had the same size, surface area and mass.
- Having to use the same equipment each time. .
The results were reliable and presented respective averages. Therefore I believe it wasn’t really essential to have taken more readings for the same result although I do agree that this would slightly increase the reliability of my results. The results were consistent. If I did want to further increase the reliability of my results, I could have obviously taken more readings to find more averages; this would mean needing more time. It would also be extremely useful to have more group members so there would be awareness of what is actually happening to the magnesium piece and more attention to specific concentrations. I furthermore had to rely on small test tubes, which meant we had to rinse and dry each one out after each experiment. It would be useful next time to have the freedom of having more measuring cylinders. Having previously cut magnesium pieces out or to have a machine cut the potatoes out more accurately would’ve definitely increased the consistency.. Finally it would be beneficial to have an alternative method of drying the equipment so to minimise the risk of absorbing water from the equipment or leaving water on the surface of the work board. Drying with a cloth may have not dried it completely.
If I wanted to extend my investigation there are a number of elements I could change such as using temperature as a variable that would be changed to see how hot or cold concentrations affect the rate of a reaction. Or we could use the size (surface area to volume ratio) as a changeable variable to see how that affects a reaction. One other factor that would be interesting to test would be how a different substance that is soluble to the solution affects the rate of reaction, we would presume that it would be extremely similar to that of the experiment held in this investigation, although there may be other factors involved.
The experiment overall was extremely successful in that the practical was completed in time and I had acquired reliable and accurate results which is proved on my line graph. I took all the necessary precautions outlined in the risk assessment of my plan. Overall I can again succeeding outline that through the experiment I have accomplished my aim and fulfilled the entire investigation.