The equipment I will use for my investigation is as follows:
-
Borer – to extract the potato cylinders;
- Measuring cylinders;
-
Beaker - to hold the solutions;
-
Electronic Balance – to take the mass of the potato cylinder;
- Scalpel;
- Safety Glasses;
-
Sucrose solution & distilled water – to create the different solutions;
- Timer;
- 2 Potato’s;
I will use a borer to take the cylinder of potato from one of the potatoes and I will the measure it to ensure all the cylinders are of a similar size. I will use a maximum length of 5cm and a take the mass of each using a balance to ensure they are the mass I will be using (which is 2.5g), which will then be recorded to ensure consistency.
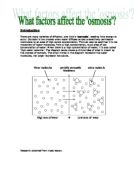
I will then place a cylinder of potato into a beaker of sucrose solution, which will be altered and will be the controlled variable. The range of solutions I will be using start from 0.2M and ascending in a pattern of 0.2M incorporating 0.4M, 0.6M, 0.8M and finishing with a solution of 1.0M. This is so that if there is a mathematical trend within my results, it will be more apparent and other patterns or trends will show much more clearly.
I will then make up the concentrations myself and pour them into a beaker and I will accurately measure the amount using a measuring cylinder. To ensure my final results are as accurate as possible while the potato cylinder is in the sucrose solution, the sucrose solutions will be all kept at the same temperature, which will be the room temperature of the designated room, and all the solutions will be kept in the same room. I will have already verified the solutions are fair because I will be producing the solutions myself. This is all in the interest of making my test fair and ensuring reliable end results. I will have already verified the solutions are as possible because all the solutions will be made by myself. I will add water to the solute to make it less concentrated or more dilute. As the table to the right shows I will add a set amount of distilled water and the remaining solution will be sucrose. I may vary the volume of water but I will keep it in proportion to the others but I may need to use a greater quantity of solution to ensure the potato cylinder is fully submerged to allow osmosis to take place.
To ensure the safety of myself and the safety of any others present in the room, safety glasses will be worn by all in the room to protect peoples eyes and I will immediately clean up and tidy up any spillages that I make to minimize the risk of an accident occurring such as the solution splashing into somebody’s eyes. The final thing I will control in my experiment is using the same potato to the greatest extent possible, or an extremely similar one if I am unable to extract enough potato to complete the investigation. This is so that variables such as different types of semi-permeable membranes are avoided. As I have already mentioned earlier, the temperatures will be controlled so that the particles in the solution or water do not gain extra energy in comparison to the others and I will use the same balance to minimize the risk of incorrect readings.
I will take six readings, one from each different solution and then repeat all six, three times to ensue that a fair test is carried out which I believe is important to ensure the accuracy of my work and allow me to draw the correct conclusions. This will mean that I end up with a total of 18 results, which I hope will be enough to give me a complete and accurate picture.
My method for this investigation is;
- Produce my solutions of six different concentrations (as detailed in the table above) and measure using a measuring cylinder. They will then be poured into the different beakers.
- Next, I will take six samples of potato from the one (or two, if I am unable to get a sufficient amount of samples from the first) using a borer and then measure the mass to ensure they are all the same. Then, simultaneously place the potato cylinders into each different beakers.
- After a set period of time I will then remove the potato cylinders from their solutions but will be careful not to mix them up.
- I will dry the cylinders and measure their mass using an electronic balance. I will then record the results in a similar table to the one below;
- I will then repeat the test another 2 times and record the results in an identical table to the one above.
- I will then draw my conclusions and evaluate my work.
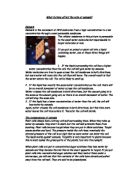
In my investigation I predict that as the concentration of solute becomes higher, that more osmosis will take place. I think that as the concentration becomes higher, the movement of water will be out of the potato, which will decrease them mass. This would show a downward trend in my final results graph, similar to the one below;
When the average loss/gain reaches 0g, the isotonic point has been reached. This is when the water concentration inside and outside the potato are equal.
I have now completed my investigation, and below is a results table alongside an averages table.
Averages
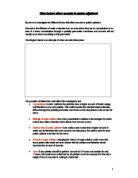
Below is my final graph and then my results in more detail;
Test one
Test two
Test three.
Outliers are highlighted in yellow.
I have not used the results highlighted as they do not seem to fit the pattern.
The Loss/Gain in % was calculated through the following formula;
Finish mass divided by Start mass multiplied by 100.
From my data set I have removed three outliers, which are all from the same test. These are the 0.2M, 0.6M and the 0.8M tests in test three. This says to me that the third test must be inaccurate in some way. This could be due to inaccurate scales or a problem of a different kind somewhere when I was doing the experiment. However even if my results are inaccurate my graph shows a trend that shows that more osmosis is taking place as the concentration of solution increases, and that the water is moving out of the potato instead of into. Although I have large error bars I still believe my graph shows this trend clearly. The isotonic point was reached in the range for the 2nd test, even though I considered this test an outlier. Nevertheless I did encounter quite a great number of outliers in my experiment, which may have affected the accuracy and reliability of my results. On the other hand all of my results error bars do overlap onto my line of best fit and the shape of my line could indicate a pattern. There seems to be a mathematical pattern within my results - the higher the concentration of solution, the more water is lost out of the potato. For example in test one my first result for 0M was 2.59g and then my result for 0.2M was 2.28g which shows a clear decrease in the weight of the potato. A similar trend happened in the second test with my result for 0.4M being 1.96g, and then or 0.6M the weight of the potato was 1.46g – a clear trend.
I have now concluded that my investigation was not entirely successful, primary in my third test. However I do believe that the first 2 sets of data show a clear and accurate pattern. I believe my third attempt at the investigation was inaccurate due to the fact I had three outliers in that try whereas I had none in either of the other two. I believe that my earlier prediction was correct if you discount the outliers as even my error bars, which show the range of the results, there is a clear downward trend as the concentration of solution gets higher. This is due to the water potential decreasing as the concentration of sucrose becomes higher. I know that my prediction was right because of the clear trend displayed by my results and the few number of anomalous results. There are 3 of these in test number 3 and this could be due to a number of reasons such as inaccurate weighing equipment or accidental inaccurate measuring of the solution/water ratio. However the results are pretty much exactly as I expected expect for the 0.2M and 1.0M concentrations across all three tests, which were higher and lower respectively than I would have expected.
I could have improved my investigation by numerous means. For example I could have used a biuret to more accurately measure my solutions or I could have chose to completely re-do any tests that contain an outlier, in my case this would be test number three. It could have also been beneficial if I had ensured that I was using the electronic balance more carefully that I was. I could also expand my work by changing other factors to see what effect that has on osmosis, such as changing the type of solution or type or plant material. However I do believe that my results gave enough information to answer my initial question, “What factors affect osmosis” and I can safely say that the type of solution does affect osmosis. Overall I believe that my first set of results were the most accurate and If I were to put my trust in any of the data set’s it would be the first one.