Plant cells
When a plant cell is flaccid, there is little water in it. They change shape, which closes the stomal pores. This prevents any more water being lost. However it also stops CO2 getting in. This means photosynthesis stops as well.
To make the cell turgid, you put it in put water. The contents of the cell will start to push against the cell wall. This gives support to the plant tissue. The stomatal pores are now open.
Preliminary Work
For my preliminary work I have decided to test three different sizes of potato to see which comes out with the best results. I am going to use a big chunk, a small chunk and a cylinder. I will use 20cm³ of three different solutions, 0.0molar, 0.6molar and 0.8molar. Into each of these I will put a big chunk, a little chunk and a cylinder. I will leave them all in for five minutes before re-weighing them.
I will but the big chunk at the top, little chunk to the left and cylinder on the right of the petri dish.
Preliminary Results
After leaving the potato in for 5 minutes, I have come up with a fairly good set of results. To make sure my actual results are as accurate as they can be I will leave the potato in for 30 minutes. I have decided to use the cylinder of potato because this will be the easiest to keep accurate when cutting. I will cut the cylinders to centimetre.
Method
In this experiment I will cut a cylinder out of a potato by using a corer. Then I will cut it into centimetre pieces. I will set out 6 petri dishes each containing a different concentration of glucose solution. In the first will be water, then 0.2 molar, 0.4 molar, 0.6 molar, 0.8 molar and then 1.0 molar. I will leave three cylinders of potato in each concentration for 30 minutes. To make sure I don’t get the cylinders muddled up when I weigh them; I will put a small dot on the top cylinder in the petri dish. After leaving the cylinders in for 30 minutes, I will take them out of the glucose and weigh them to see how much the mass has changed.
Apparatus
Knife, Petri dish, Potato, Glucose solution, potato corer
.
Control
Fair Test
I will make a control to help ensure I do a fair test. I need to make sure that my experiment is a fair test because otherwise my results would be unreliable. Also to help keep a fair test I will change only the glucose concentration. I will use 0.2, 0.4, 0.6, 0.8 and 1.0 molar. All other factors will be kept the same. Here is a list of things I will keep the same.
- The temperature (Room Temperature)
- The mass of the potato
- The volume of the solution
- The top pan balance
- The time each potato is in the solution
These must all be kept the same if I am to complete a fair test. This is because, for example, if one of the pieces of potato was ½cm bigger than the others, there would be a larger surface area and therefore more space for osmosis.
I will take 5 different measurements and then have 3 pieces of potato for each. This means I will be able to take an average. This will make my results more accurate and reliable.
Safety
Whilst doing this experiment there will be some precautions I need to take to ensure safety. Firstly I will have to take care when cutting the potato to make sure I don’t cut myself and the scalpel will be sharp.
Also there are a few things I need to watch out for during this experiment. I need to make sure I have clean and dry hands each time I handle the potato. This will stop any extra water entering the potato and affecting the osmosis rate.
Prediction
I predict that the mass of the potato will increase as the concentration of the water in the glucose solution grows in strength. Then as the solution becomes more concentrated the increased mass will start to decrease until it is almost back to it’s original mass. Therefore, the more concentrated the solution is, the smaller the mass gain should be. The reason for my prediction is that when the concentration of the solution is weak, the water, which is in the solution, is greater than that in the potato cells. Therefore osmosis occurs and the potato cells take in water from the solution. If there is a higher concentration of glucose in the solution, the water will be drawn out of the potato cells into the solution by osmosis. This is because osmosis is the movement of water from a high concentration (which would be in the potato cell) to a low concentration (in the glucose solution).
Analysis
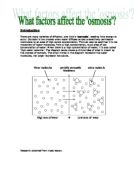
Osmosis is the movement of water from a high concentration to a low concentration through a selectively permeable membrane.
In my experiment, the water began moving into the potato because the concentration was higher outside the potato. As the concentration got higher, the water started to move out of the potato as the water concentration was lower outside.
My graph shows the line of best fit for the average percentage change against the concentration of the glucose. The line is a curve that slopes downwards. Because the line is not straight, it means that the percentage gain and loss in mass and concentration are not proportional. However, I have found a pattern. This is that as the concentration decreases that average percentage change increases.
At the first point, 0.00M there was a 10% average percentage change. This was because the concentration of the glucose was weak. This meant that osmosis happened. The water was drawn from the high concentration, outside the potato, to a lower concentration, inside the potato. The potato cell was turgid when I reweigh it because the water moved into the potato cell.
At 0.2M, the cell is still turgid. This is because the concentration is still weak so the water moved into the potato cell.
The slope of the graph then starts to descend. This is because the cell is becoming more and more flaccid. A 0.4M, the cell is becoming flaccid. The average percentage change is now negative. As the concentration is increasing, the percentage change is decreasing. This is because the concentration of water is becoming stronger inside the potato, so the water is moving from the potato cell into the surrounding glucose solution.
At 0.6M, there is a big drop. The average percentage change goes down to –25%. The cell is turgid. After this point, the curve starts to go back up.
0.8 and 1.0M are almost the same. This is because the concentration of glucose is so high that most of the water moves by osmosis from the potato to the surrounding glucose.
My graph shows that my prediction was right. The potato cells increased in mass when the solution had a high water concentration and decreased in mass when the solution had a low water concentration.
Evaluation
I think my experiment went quite well. Most of my points fitted the line of best fit. I was left with just two anolomous results (which I have circled on the graph), at 0.4M & 0.6M. Point 3 was only slightly too high. I could have measured out the size of the potato wrong or worked out the percentage change wrong. However point 4 was more wrong. This could be for the same reason, as picking the potato up by hand would have made the experiment more inaccurate. I would have expected this result to be about 17 or 18%. To get rid of these results if I did the experiment again, I would use more technology. This would make my results more accurate.
I found it difficult to cut the potato accurately. This meant that at the start of my experiment, all of my potato cells had a slightly different mass. If I did the experiment again, I would like to find a cutting machine that would cut each piece of potato for me. This would mean I could be sure that each of the pieces of potato had the same mass and also the same surface area.
Also I would like to have used a wider range of concentrations. This would mean I could have a larger amount of results and then could see further into the affect the concentration of the glucose has on the rate of osmosis.
If I did this experiment again, I would use more technology, for example telescopes and computers. This would mean I could have got a more detailed analysis and been able to find out more about the turgidity and flaccidity of the cell. If I looked at the potato under a microscope after it had been left in the glucose solution, I would be able to see each cell and whether it was flaccid or turgid.
I am generally confident about my results. I took an average from three sets of results to give me some accuracy. Also my graph has got a good line of best fit which went through the majority of the points.
A Further Experiment
Method
To explore this experiment further, I could use three different size cylinders in each solution. This would allow me to see whether size affected the rate of osmosis. I would keep the concentration of glucose the same so that there are not too many different factors. In each petri dish I would have 3 cylinders of potato. I would have masses of 1g, 2g & 3g. I would leave the potato in the glucose concentrations for 30 minutes. This is because I got a good set of results in my last experiment when I left the cells in for 30 minutes. Once I have done this once a recorded the results, I would do it twice more so that I have got three sets of results and am able to take an average. This may be time consuming, but it would hopefully give me accurate results.
Fair Test
To ensure the experiment is a fair test, I will keep some factors the same throughout. I will keep the temperature of the room, the concentration of glucose, the time each potato is in the solution and the volume of the solution the same so that all of the cells have the same conditions. Also I will keep the top pan balance the same in case one is slightly different to another.
Prediction
I predict that as the mass of the potato increases, the rate of osmosis will increase. This is because the bigger the potato is, the larger the surface area is. This means that there is more room for osmosis to happen.