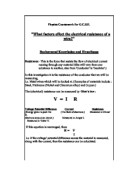
Hence, I could represent this by the following equation:
R I
A
Resistance. Cross-sectional area of the wire.
(Inverse proportionality, or negative correlation.)
This is effectively a quantitative prediction
i.e. Numerical predictions can be made if this theory is accurate.
e.g. Inverse proportion
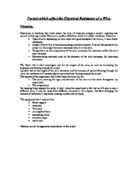
Diagram (Not to scale)
The wires must be the same length, otherwise you will be varying more than one variable in the experiment, therefore the experiment performed will not be a fair test.
2Amps
High resistance (electrons are close together).
2Amps
Low resistance (electrons are spread out).
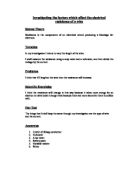
2. The Length of the wire
I predict that the resistance of a wire will be directly proportional to its length,
i.e. R L (Positive linear correlation)
i.e. Increasing the length of the wire means that the resistance of the wire also has to increase because there are more 'particles' within the wire to block the flow of the current. Logically I expect this to result in a simple quantitative prediction.
e.g.
Here the wires have to be the same thickness, otherwise more than 1 variable will be experimented with and therefore make it a unfair test.
(N.B. Also for each of these two hypothesis the materials of the wire(s) must be the same, again to perform a fair test.)
3. The Temperature of the wire
According to theory (ref. Advanced 'A' level physics), metals conduct better when at low temperatures and poorly at high temperatures. This is because, at a low temperature the atoms/ particles within a wire are hardly moving, therefore do not block the flow of electrons (and these are the charge carriers), but as the temperature increases, the particles have increasing Kinetic Energy and therefore are vibrating increasingly faster, hence will steadily 'block' the flow of electrons through the wire, so resistance of the wire also steadily increases. On this basis, I would expect an inverse relationship between R (resistance) and T (temperature).
i.e. R I
T
The only problem I can anticipate here looking at this prediction is how to control the temperature, because when wires have 'higher' resistance's they become hotter anyway, therefore the control of the temperature might become difficult, so maybe only qualitative,
i.e. Generalised results might be obtained
Another difficulty is that, if that this relationship is true, the metal wire might melt before you reached the temperature required for the result needed.
I tried a simple experiment to see whether testing this hypothesis could be predicted, but controlling the temperature of the wire was virtually impossible, therefore it made it made no sense to continue with this hypothesis.
Safety Precautions (Risk Analysis)
1. In all experiments the bare wires (i.e.. resistance wires) should not be
touched to avoid an electrifying experience!
2. All circuits must incorporate a switch for reasons of safety. (Usually this will be on the power pack used, unless a battery/ batteries are
used, where this will make necessary a switch directly in the circuit itself.)
3. Ensure no water gets anywhere near the circuit, to avoid electrocution, short circuits, etc.
4. Avoid using too high a voltage(s) because, high voltages can overload the circuit and cause melting of the resistance wires.
Plan
To test out any of these hypotheses an electrical circuit will be needed to be devised which must be used in every individual experiment (so you have a fair, i.e. results can be compared fairly and logical conclusions can be drawn).
In every case of the hypotheses the resistance of the wire needs to be calculated, hence the use of Ohm's law,
i.e. R = V
I
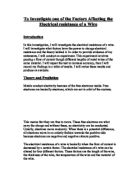
therefore for every one of the following experiments the voltage will need to be measured (otherwise known as the Potential Difference) and similarly the current also has to be measured. Now since I am going to measure in the first two hypotheses the electrical resistance's of wires, I can therefore use the following basic diagram:
Power pack (2-12 V).
Usually no more 1-4V ( 2).
Ammeter
(Measures electrical current in Amps)
Wire to be tested
either for different Voltmeter/ Potentiometer
thickness' or different (Measures the voltage/ potential difference
lengths of wire. across any electrical component)
Method for Hypothesis 1 (Varying the thickness of the wire, i.e. cross-sectional area of the wire).
For this, a range of different gauges of metal wire will have to be used, each of the same size. All other variables, i.e. components used in the experiment, to perform a fair test, will be necessary to be kept the same for each time the experiment is performed.
I will place the resistance wire between a pair of crocodile clips making sure I mark the clips so the pieces are joined at the same distance each time. I will then set the output of the power pack to 2 volts (V), then record the readings on the Voltmeter and Ammeter, for 5 different gauges of wire. (I have chosen to use Nichrome wire for each of test. This could lead to another hypothesis where you use different metal wire to see how resistance's differ there. The length of each piece of Nichrome wire will be 10 cm.)
During the experiment I will record the results on the results table. There are three trial columns where the mean voltage/ current/ resistance can be found and recorded.
Method for Hypothesis 2 (Varying the length of the wire used).
Essentially I will repeat the method for Hypothesis 1 expect this the variable in the experiment is the length of the wire, using wire of the same thickness/ gauge. Then record the voltage and the current across each wire to calculate the resistance of the wire.
As before I will use power pack with a output of 2 volts. (Any higher than this could cause melting of the wire and secondly it will minimise the danger of electric shock.)
During the experiment I will record the results on the results table. There are three trial columns where the mean voltage/ current/ resistance can be found and recorded.
RESULTS TABLE FOR THE THICKNESS OF THE WIRE
RESULTS TABLE FOR THE LENGTH OF THE WIRE
Analysis of results/ Conclusions.
I originally made predictions for the effects of the two variables under investigation and these were :
(i.) Resistance of the wire will be directly proportional to its length (i.e. there will be a positive correlation which can be shown as R L).
Resistance Length
( ) ( cm )
R L / R I These are in all Physics textbooks and therefore 'Scientific Laws'.
A
This relationship should be Linear and so if plotted on a graph should plot a straight line.
My experimental results (Table 1/ Graph 1) tend to suggest that my original hypothesis was correct, because even though 'I didn't have to plot' a line of 'best fit' the mean values obtained for each reading were close enough in agreement to allow for a line of best fit. So, I believe I am justified in saying that my original hypothesis was correct. Obviously, to check for the validity of this beyond any doubt, I would, if I repeated the experiment, increase the number of experiments.
i.e. show a greater range of lengths overall, to see whether the rule is true, or whether the rule desists at a point.
(ii.) Resistance of the wire will be indirectly proportional to its cross-sectional area. (i.e. There will be a negative correlation, which can be shown as R I
A
Resistance Cross-sectional area
( ) (cm )
and so if plotted on a graph should plot :
Unfortunately, it wasn't possible to find wires with the values of the cross-sectional areas in cm . Instead the values were given as gauges (I couldn't find the conversion units for these, apart from the fact, that a low gauge wire is 'thick', and a high gauge wire is 'thin'.)
If we look at my results for this hypothesis (Table 2/ Graph 2), as in the first set of results I did produce A line of best fit and it does a negative correlation, my only concerns are in using the gauge number, i.e. because I don't know the actual values, it is possible that my results are not totally justifiable, even though at first sight they appear to be in close agreement.
For example, for all I know, the graph should have produced an exponential decay/ half-life curve.
My only way of checking this would be to repeat the experiment and be able to plot the actual cross-sectional area accurately, which I wasn't able to do, and, probably with the previous variable, a greater number of trials and a range of readings would be desirable.
However, bearing in mind the circumstances, I do believe that I carried out a 'fair test' in each set of experiments to produce results which are consistence with my initial predictions.
Evaluation
Within the basic plan I adopted, the experiments worked fairly effectively. I did notice, on the odd occasion that one or two of the wires became hot (i.e. there was a red glow), so I ensured that the readings were taken as quickly as possible so I could switch off the circuit, before the wire melted.
As I have already stated, it would have been better for my second hypothesis if I had known the actual values of the cross-sectional area of the resistance wire(s) for the experiment(s). So if I was to repeat the experiment then I would try to find the values of the thickness of the resistance wire some how, even if that meant contacting the manufacturer's for the raw data.
As I stated in my analysis the results I obtained are in very close agreement to my prediction, bearing in mind that I did construct the line of best fit. Obviously, it would have been better to have had more trials and a greater ranges of readings, but with facilities available, I think that the results proved more than satisfactory to my initial conclusions. There are a few anomalous results, which I have put a 'star' next to, on Tables 1 and 2. These could have occurred due to experimental error, i.e. me making mistakes in taking the readings or in the measuring the correct lengths of the wires, but I was very careful in the measurements taken to carry out a 'fair test' as thoroughly as I was able to. It is, however, possible that the materials themselves might contain an imperfection/ impurity which might result in strange readings and according natural law, there will always be readings that will be above and below the expected value (i.e. they follow a normal distribution).
There are several areas which in theory I could extend this investigation if I had another opportunity to do it.
e.g. I could see what happens if the two variables, i.e. length and cross-sectional area are varied at the same time. I suspect that probably the two relationships could be expressed in an overall equation, namely,
R L
A
Also, clearly different materials will have different resistance values, because they have slightly different structures.
i.e. Some materials will be poorer resistors and others will be better resistors. So the same hypothesis tests could be carried out on other materials.
Also initially I thought about testing out the temperature of the material as a variable, but having done a trial experiment, I found this was a waste of time, because there was no accurate way in which I could record the temperature of the wire.