History of Spectroscopy
Spectroscopy has been used as a method of quantitative chemical analysis before the beginning of the twentieth century. Spectroscopy started in 1666 when Sir Isaac Newton passed rays of light from the sun through a glass prism and observed the colours of the visible spectrum, another great breakthrough concerning spectroscopy was the suggestion of transition between energy levels within atoms as the source of spectral lines was great contribution made by Niels Bohr in 1913. At the end of the nineteenth century, spectroscopy was limited to the absorption, emission, and the scattering of visible, ultraviolet, and infrared electromagnetic radiation. However, during the twentieth century, spectroscopy was extended to include other forms of electromagnetic radiation including photo spectroscopy e.g X-rays, microwaves, and radio waves, as well as particle spectroscopy.
Functions and Description of a spectrometer
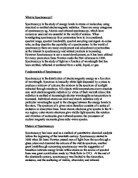
Fig 1. Schematic diagram of a spectrometer employing photomultiplier as detector.
A spectrometer usually shows pointed distinct features, instead of curving wavelengths; the sharp structure used is particularly obvious when the substance investigated includes atoms in the gas stage. The sharp characteristics normally appear in clear patterns, and the precise line pattern observed is strongly characteristic of the chemical species producing it, and the spectrum is always, repeat always, a unique signature that signifies the presence of that species.
The different spectroscopy terms cover the spectrometer’s aptitude in different areas. Spectral range covers spectral absorptions and has various spectral ranges that are controlled by detector technology, for example: ultra-violet, visible, near infrared and etc, also the wavelength range is sometimes referred to in the distant sensing idiom as the visible near infrared. The spectral bandwidth concerns the width of an individual spectral channel in the spectrometer, and the narrower the spectral bandwidth is, the narrower the absorption feature the spectrometer will accurately measure. The spectral sampling is the distance in wavelength between the spectral band pass profiles for each channel in the spectrometer as a function of wavelength, also to resolve two spectral features there must be two samples. Finally the signal-to-noise ratio depends on the previously mentioned spectral features, the signal-to-noise ratio is dependant on the detector sensitivity, the spectral bandwidth, and the intensity of the light emitted for the measured surface. The spectrometer’s structure and features are inter-reliant when concerning the instruments measuring capabilities.
Atomic Emission Spectroscopy
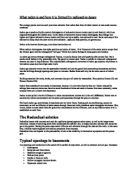
Fig 2. Schematic diagram of a multi-channel atomic emission spectrometer, showing the arrangement of multiple exit slits and detectors for the simultaneous analysis of several elements
Atomic emission describes all forms of emission from atoms; these are mainly electrons, x-rays and optical photons. Guystav Kirchhoff and Robert Bunsen first used atomic absorption, along with atomic emission, in 1859, as a method for the qualitative identification of atoms. Atomic Spectra is when a given spectral line corresponds to the transition of an electron between the two specific energy levels. Atomic absorption spectrophotometers are intended for using either single-beam or double-beam optics for molecular absorption spectrophotometers. Atomic Spectroscopy using either flame or electrothermal atomisation is commonly used for the analysis of trace metals in a variety of samples. Atomic spectroscopy is when a set of certain frequencies of electromagnetic radiation (i.e. light) is emitted or absorbed by atoms of a certain type.
Mass Spectroscopy
Mass Spectroscopy is a diagnostic technique that is used to classify unknown substances, to measure those compounds and to illuminate the structure and chemical properties of molecules. Mass Spectroscopy is used to identify structures of biomolecules, perform forensic and environmental analyses, to identify and quantitate compounds of complex inorganic mixtures and to perform ultra sensitive multielement inorganic analyses. Mass spectroscopy originated in 1919 by a British scientist named Francis Aston when a machine was created for the purpose for measuring the proportions and masses of the atomic species in part of a sample. A mass spectrometer is an instrument that measures the masses of individual molecules that have been converted into ions e.g molecules that have been electrically charged. A Mass Spectrum is a plot of ion intensity as a function of the ion’s mass-to-charge ratios.
Spectroscopy is a diverse and complex branch of science. It has many uses and is widely acknowledged as an essential part of development in the world of science.
A spectrum is an image or distribution of colour of any electromagnetic radiation arranged in a progressive series according to wavelength.