I also predict that if I increase the concentrations of the sucrose solution twice the potato chip will lose its weight by twice as well.
Diagram:
Factors affecting how well the experiment will work:
The factor affecting how well it will work will be:
-If solution is slightly different it may change results slightly.
-Potato chips size.
-If you don’t dry off all excess solution.
-If you lean on the bench scales could slightly change results.
-The time could be slightly too short or long from the other times maybe changing results.
Fair test:
To have a fair test some aspects of the osmosis experiment will have to be kept the same whilst one variable will change. The concentration of the sucrose solution will be the variable that will change.
For the purpose of my experiment I am going to carry out six experiments at the same time so the temperature of the six experiments is kept the same throughout. I will measure the mass in mililitres (ml).
The mass of the potato is another variable too but it will not effect the experiment to much. I will measure the mass in grams.
This means that it will be measured throughout the experiment (before it is put in the solution, and after.). This will allow me to see whether any osmosis has taken place, and to what extent.
The volume of the solution that the potato chips are kept in must be the same it will be 20 ml. The potato chip must be totally covered in the solution, and the amount of solution will be kept the same because all the potato chips will be the same size. I am also going to use the same scales to weigh my potato chips. This is because the measurements could slightly differ between different sets of scales.
Here is a table to show how the concentrations were mixed to get the concentrations we needed for the experiment:
Plan:
I am going to have six experiments going on at one time, 0 molar, 0.2 molar, 0.4 molar, 0.6 molar, 0.8 molar and 1 molar as my concentrations, and I will have 20ml of each. I will add different combinations of sucrose solution and water to make up these concentrations (As shown in the table above). They will then be put in different test tubes and each will be labelled.
I have planned to use six different concentrations of sucrose solution. For each concentration I will take three results. When I have all my result, I will find the difference between the start weight and end weight. Then I will be able to find the percentage change for all the results, Also I will be able to find out an average molar increase or decrease.
To make it fair I decided to leave them in for the same amount of time because this would allow the same amount of osmosis to take place in each test tube with every concentration of solution. By making sure that I had exactly the same amount of solution in each test tube it made my results a lot more accurate and fairer.
The volume of the solution, the chip is put in can be kept the same because the chips are all of the same size. When weighing the weight of the potato chip on the scales, you must not lean on the side as it may affect the weight.
The more results you have the more accurate you graph will be, so when I come to do my experiment I will repeat it three times. I must also make some labels to label my test tubes with so that the test tubes do not get mixed up. I can also see that there will be some anomalous results, so if I do repeat the experiment, I will get a more reliable average. Also changing the other aspects e.g. such as emptying out all the solutions, after 20 minutes, will hopefully produces less anonymous results.
After weighing the potatoes and recording the weight. I will place them into test tubes of containing 20ml of the relevant solution. The Potato chip is left in the solution for 20 minutes. I shall use a clock to time this.
Then they will be removed, gently rolled to remove excess solution, and then weighed again to get the weight after the experiment. I will repeat this experiment afterwards three times to get more accurate result.
Then I will wash the test tubes and re-use them I must wash them so that no solution is left in them that might change my results I will then remove all the solutions from the test tubes as quickly as I can, and take the potatoes and weight them and record the results. There are will be 3 results per concentration so I can work out an average. This plan will be a good way of carrying out the experiment because it explains ways to be careful and if I am careful this experiment should go well and safely.
Results:
Experiment 1
Experiment 2
Experiment 3
Results to find Average Difference in grams and average Percentage:
Results for Average:
Graph:
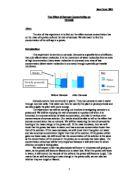
Evaluation of Graph:
The graph shows the line of best fit for the average results weights of potato chips in different concentrations of sucrose solution. It clearly shows that in low concentrations of sucrose solution, the potato chips get larger and in higher concentrations of sucrose solution, the potato chips get smaller. This graph shows that the average weight after Osmosis and the concentration of sucrose solution are not directly proportional. It shows the average results in grams.
There is, however, a pattern in my graph, showing that the average weight after Osmosis and the concentration of sucrose are inversely proportional. As the concentration of sucrose rises, the average weight after Osmosis decreases. This graph shows that my first predictions were correct. It shows that the potato cells increase in mass in solutions with a high water concentration and decrease in mass in solutions with a lower water concentration
Analysing the results and drawing conclusions:
I have drawn a line graph of concentration of sucrose solution against percentage of mass change, it shows that the potato chips goes up in mass when the water concentration is high and decreases its mass when it is kept in a solution with low water concentration. The evidence obtained form this investigation supports the predictions I made.
In lower concentrations of sucrose, Osmosis takes place and the potato chips become turgid (swollen, larger, the mass of potato chips increases). In higher concentrations of sucrose, Osmosis takes place but the potato chips become plasmolysed (smaller, the mass of potato chips decreases).
In my experiment, the potato in the water had a 1% gain in mass. The potato in the 0.15 molar sucrose solutions had loss of mass of about 2%, the potato in the o.25 molar solution had a loss of mass of about 3.0 %. The potato in the 0.5 molar solution decreased by 6%, the potato in the 0.8 molar solution decreased by about 10% and the solution in the 1 molar solution decreased by 13%. These prove that the higher the concentration of water in a cell the more it gains mass. The experiment helped me to find out that osmosis occurs between two liquid substances with a partially impermeable membrane, and that higher the water concentration is the larger the increase in mass in grams.
Evaluation:
In my opinion, the experiment was very successful. I obtained a large quantity of quite accurate results. There does not seem to be any results, which undermine my prediction, and I did not find any anomalous results. I believe we gained accurate and sufficient enough results, shown on our graph and table that concludes the experiment, and to prove our prediction. My final results were very reliable, due to the precautions I took to make this a fair test. I also think that I gave the experiment long enough time for Osmosis to occur. Maybe if I were to repeat the experiments again I would probably try using a wider range of concentrations as to find a wider range of more varied results.
The most difficult part of this experiment, I think, was the accurate cutting of the potatoes. It was very difficult to accurately cut the potatoes to the same length and to get them all to the same weight, even though I did use scales not everyone would come out exactly the same.
In my opinion, slight differences may have been the result of human hands drying each, some more thoroughly than others. This could mean that some would have had more excess water than others, resulting in an increased mass. However, I think that my experiment was successful and am quite pleased with my results.
Further work could be carried out to include concentrations that increased in 0.1 M rather than irregular interval. This would increase the accuracy and the graph. Other investigations could include using different varieties of potato or different plant tissue such as carrot or apple.
Another way of improving the results would have been to leave the experiment running longer, this would have enabled me to find the saturation point (when the potato can no longer take in any more water) and dehydration point (when the potato cannot lose any more water)and therefore get a more accurate result.
Finally, I could extend the experiment to a more exact level by looking at the potato cylinders under a microscope, and then I would be able to see the cells in greater detail and draw some more observational results.