Cork Borer – In order to ensure that all the potato pieces have the same surface area/diameter.
Electric Balance – used to weigh the potato pieces as accurately as possible (to 2dp).
Sucrose solution – different concentrations of this will be added to water to gain the solution needed for each part of the experiment.
Potato pieces – Basis of the experiment, used to see what concentration of sucrose is needed to achieve the isotonic point.
Syringe – Measures the amount of sucrose added to the water to make the solution.
Measuring cylinder – Measures the amount of water added to the sucrose solution to make up the final solution.
Method
Nine petri dishes are to be labelled with their corresponding numbers, containing 40ml of solution. In each dish, a different concentration of sucrose solution should be placed. The solutions and their respective dishes are shown below:
Petri Dish One: 50% sucrose concentration (20ml sucrose – 20ml water)
Petri Dish Two: 100% sucrose concentration (40ml sucrose – 0ml water)
Petri Dish Three: 0% sucrose concentration (0ml sucrose – 40 ml water)
Petri Dish Four: 75% sucrose concentration (30 ml sucrose – 10 ml water)
Petri Dish Five: 25% sucrose concentration (10 ml sucrose – 30 ml water)
Petri Dish Six: 60% sucrose concentration (24 ml sucrose – 16 ml water)
Petri Dish Seven: 40% sucrose concentration (16 ml sucrose – 24 ml water)
Petri Dish Eight: 65% sucrose concentration (26 ml sucrose – 14 ml water)
Petri Dish Nine 35% sucrose concentration (14 ml sucrose – 26 ml water)
Potatoes are to be cut into 27 identical cylinders with the cork borer. These cylinders should be weighed accurately with a balance, and the relative information recorded into a result table.
Three pieces of potato (A, B and C) should be placed evenly spaced, into each petri dish. Red pigment cardboard is to be used to separate the potato pieces into their own sections, which is labelled on the dish with a marker, so that each potato piece can be identified at the end of the experiment. Clingfilm should placed over the petri dishes, preventing the evaporation of the sucrose solution, and effect from other outside factors. This is done so that the concentration of the solution does not change, and so that all nine petri dishes are in an identical environment to keep the experiment fair. The petri dishes should then be left overnight. In an idyllic situation, the mass of the potato cylinders would be checked hourly, but as this is not possible, the mass should be checked after 24 hours. These masses are to be recorded in the table below.
Fair Testing
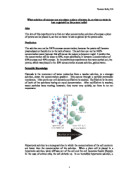
The concentration gradient effects osmosis more than anything. If there is a large concentration gradient, there will be a large net movement of water. If there is a small concentration gradient, there will be a smaller net movement of water. The rate of osmosis is faster with a larger gradient, and slower with smaller gradient. The concentration can be varied in order to achieve the concentration gradient where there is no net movement (for an isotonic solution).
This experiment has a single factor, solution concentration. All other factors are to be kept constant, such as the solution volume, type of water (distilled), surface area and size of potato before the experiment, variety of potato and temperature.
A cork borer is used to ensure that every potato piece is the same size. A top pan balance is the most accurate form of weighing available to me. Cling film is placed over the petri dishes to ensure that no outside factors affect osmosis, and no evaporation occurs. The potato pieces are placed on a paper towel for sixty seconds each, to ensure that all pieces receive an equal amount of time for excess water to drain. To ensure that there are no anomalous results, three potato pieces are used for one concentration, and then an average is taken.
Factors to control:
- Temperature
- Size of potato cylinders
- Amount of solution used
- Use only one variety of potatoes
- The same type of water must be used (distilled water)
Planned Results Table
Preliminary experiment
A preliminary experiment was carried out with one petri dish. This dish contained 10ml water and 10ml sucrose. 3 pieces of potato cylinders were placed in the dish. These were weighed before the experiment and after 24 hours, they were reweigh to see if any change in weight had occurred. The results are shown in the table below.
Results table
The results show that 50% water and 50% sucrose made the solution weak. More sugar solution is needed in the main experiment.
Calculations
Change in Mass = Mass After Experiment – Mass Before Experiment
% Change in mass = Change in mass X 100
Initial Mass
Average % change in mass =
% Change in mass for potato A = Change in mass for Potato B = % Change in mass for Potato C
Predicted Graph
Where the line of best fit is horizontal, it shows that no more water can diffuse in or out of the cell. Remembering that this is only a prediction, where the line of best fit is above the x-axis, the cells gain water, and mass. Therefore, where the line of best fit is below the x-axis, cells lose water and mass. The line crosses the x-axis at the isotonic point. At the isotonic point, and straight parts of the curve, no net diffusion occurred.
Planned results table
Results
Graph
(See graph paper)
Analysis
The graph showing the results from the experiment has a curved line of best fit, meaning that osmosis reduces. At the lower concentrations, there is osmosis occurring in the potato cells, but there is less as we approach the isotonic point. As concentrations increase, osmosis occurs, and water leaves the potato cells, and mass falls. Towards the end of the best-fit line, osmosis slows down once again. The isotonic point is where the line of best fit meets the x-axis.
In the petri dish one, the average percentage change in mass was 25.7% increase. The solution is hypotonic, water will move from the solution and into the potato cells.
In petri dish two, the average percentage change in mass was a 0.9% increase. The solution is hypotonic, water is moving from the solution, into the cell.
In petri dish three, the average percentage change in mass of a 13.5% decrease. The solution is hypertonic, water is moving from the potato cells and into the solution.
In petri dish four, the average percentage change in mass of a 22% decrease. The solution is hypertonic, water is moving from the potato cells and into the solution.
In petri dish five, the average percentage change in mass was a 24.2% decrease. The solution is a hypertonic solution, water moves from the potato cells into the solution.
In petri dish six, there is an average percentage change in mass of a 35.8% decrease. This is a hypertonic solution, water is moving from the potato into the solution.
In petri dish seven the average percentage change in mass was a 40.7% decrease. The solution is hypertonic, water is moving into the solution.
In petri dish eight, average percentage change in mass was a 42.9% decrease. The solution is hypertonic, water is moving from the potato cells into solution.
In petri dish nine, the average percentage change in mass turned out to be a 47.1% decrease. The solution is hypertonic, water moved through the potato and into the solution.
Conclusion
From the above, I can conclude that the isotonic point is between 35% sucrose concentration, and 25% sucrose concentration. This is not the range that was concluded from the preliminary experiment. The range predicted in the preliminary is from 60% - 40%.
I think that the main reason for this is due to the difference in accuracy of the two experiments. Only one piece of potato was used per solution concentration, and three different concentrations were used in the preliminary experiment. This is opposed to the three pieces of potato per solution concentration, for nine different concentrations, and then, an average per concentration was taken. This makes the actual experiment much more accurate than the initial experiment.
Using the graph, the isotonic point is 26% sucrose concentration. However, this may not be as accurate as possible, due to the human error involved in drawing a line of best fit.
Evaluation
I think that my final experiment was reliable. It was as accurate as possible, when conducted with the available facilities. Most of the variables were controlled. However, the temperature was not kept constant. This is an important factor, and although the petri dishes were kept in the same place for 24 hours, the temperature at night in a lab is not the same as during the day.
However, considering that all the petri dishes were kept together, this should have not affected the experiment too much, as all the dishes were subjected to whatever temperature change occurred. The temperature does affects the rate of osmosis, so the experiment would have been more accurate if it was conducted in controlled environments. This means that the results of this experiment can not be compared to the results of the same experiment conducted at a different time in the year, under different temperature circumstances.
Human error could have affected the experiment more than any factor. All anomalous looking results have been highlighted in red in the main result table. These probably occurred due to inaccurate recording, or other human error. The potatoes may have been slightly different, or the solution concentration could have differed.
To ensure that all osmosis had occurred, ideally, the potatoes’ masses should have been recorded every two hours. When there is no difference between the previously recorded result and the current result, osmosis has stopped occurring.
To make the experiment more accurate, more frequent readings and more potato pieces per solution concentration are a good idea.
Extension
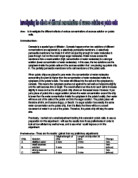
For an extension experiment, the focus could be the isotonic point in different types of potatoes. You could explore the isotonic point in Boiling Potatoes such as Round White or the Round Red and Baking Potatoes such as the Russet (see www.potatoes.com):
The method would remain exactly as before, and the nine petri dishes could be prepared for Round Red potatoes. At the same time, nine petri dishes could be prepared for Russet potatoes. The rest of the experiment would be exactly the same down to each and every detail. A result table (like the following) could be filled out for the Russet, and one for Round Reds.