Method
We decided that to obtain enough, reliable results we needed to take readings from lengths of wire from 30cm to 100cm, at 5cm intervals (15 results in all). We were in a group of three and we all took separate results from 3v, 5v and 7v. I took results at 7v. Having the investigation measured at different voltages would hopefully allow us to find a correlation, if we can find one! Also to predict other results. Our method that we used is written below in note form. There is also a diagram:
- Plug the power pack into a mains socket.
- Set the power pack to the desired voltage - 7v.
- Plug one of the ammeter ports into the negative socket using a connecting wire. (Make sure it’s DC that you’re using)
- Plug a connecting wire into the positive socket and put a crocodile clip on the end of it.
- Plug another connecting wire and crocodile clip into the other ammeter port, with the small scale selected.
- Lay the wire along side the metre stick and clip these two crocodile clips onto either end of the wire, 30cm apart.
- Plug a second connecting wire into the ammeter end crocodile clip and voltmeter.
- Take a final wire from the remaining voltmeter port and clip it onto the wire 2cm in from the power pack end.
- And if you’re not confused then carry on!
- Turn the power pack on.
- Accurately collect and write down results from the two meters
- Turn off the power pack
- Disconnect the power pack end clip and voltmeter clip
- Move both sets of clips 5cm along the test wire, turn on the power pack and collect the next set of results.
- Carry on points 10 – 14 until you reach 100cm.
It took more than one person to collect some results.
There was one change made from the original method and that was we had all planned to start our recordings at 10cm, but at that length the wire over heated and snapped at 7v so I had to move it all the way up to 30cm. Fig.1 - Method Diagram
Fair Test Points
Try to make sure all the following are taken into account when carrying out the experiment to make it as fair as possible:
- Make sure the wire is the exact length.
- Make sure meters are reset before use.
- Take and record results as accurately as possible (use mirrors on the back of meter scales).
- Use the same type of wire each time.
Null Hypothesis (HO)
The change in length of wire will have no effect on the calculated resistance of the wire, or the resistance will decrease as the length of wire increases.
Hypothesis (HI)
The calculated resistance of the wire will increase significantly as the length of the wire increases.
Prediction
I think the resistance of the wire will increase steadily as the length of the wire increases, causing a strong positive correlation. I also think the resistance that we will calculate will start at a low range of ohms (at a length of 30cm) and rise quite a lot, to approximately 30 to 40 ohms, at 100cm.
Results
Results table
My table shows the data I collected, also with the calculated resistance of the wire length (Resistance=Volts/Amps).
Fair Test Points
Try to make sure all the following are taken into account when carrying out the experiment to make it as fair as possible:
- Make sure the wire is the exact length.
- Make sure meters are reset before use.
- Take and record results as accurately as possible (use mirrors on the back of meter scales).
- Use the same type of wire each time.
Sketch graph to show my results:
Results
By looking at my Graph and results table, my predictions were quite close, with a positive correlation throughout my result range. But I think by looking at the graph that it would have been even more accurate if I had started recording data at 55cm. The resistance of the wire to the length of the wire, showing that as the length increases, the resistance also increases. There is a line of best fit and it is possible to predict other results at different lengths.
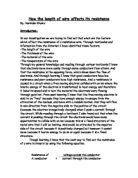
Conclusion
The experiment that I have carried out, shows that the resistance is definitely affected by the length of wire.
Evaluation
The method I chose was not the best for accurate results and so was chosen for the following: -
- Quick and easy to set up, and take apart each lesson.
- Quick and easy to take results and measurements.
- Not to involve any complex equipment.
- Safe and hassle free.
I think the data I collected was in general accurate but does appear to have a fault between 30-50cm. This is reflected in the results – the graph shows a positive correlation, with only the sharp decline of what could be a fault in my result taking, a fault in the wire or meters. The experiment was carried out to the best of my ability. I thought my range was maybe not wide enough but for the time and conditions I had it was not bad. These few points are more likely to be real but could be the result of a poor method, mistake or a failure in the equipment.
Some changes in the method may have to be changed to ensure a faultless experiment. For example I could have been quite a bit more accurate with the length of wire. It would be interesting to investigate further some of the flaws I think may have occurred, for example: - the affect of heat on the wire’s resistance.