Preliminary results:
Preliminary work is the work that is done beforehand for you to know that the values of the different apparatus you are going to use. It is a way for the person carrying out the experiment to know that it has been set up correctly for when the actual experiment begins.
Volumes of NaOH needed to neutralize 250ml of the manufacturers vinegar
Apparatus:
- Clamp
- Burette
- Flask
- Vinegar
- Indicator
- Funnel
- Mat
- Measuring cylinder/ml
Diagram:
Method: before I started the whole experiment I preformed a preliminary experiment which enabled me to gather results from the same experiment on a smaller scale, this is good to do as it ensures you not making any mistakes affecting the next experiment. It also gives you a quick idea of how to perform the experiment and how to record the data.
- Make sure all obstacles are removed, example: books off the desk, bags to one side, and any other valuables or breakables are removed from the work area
- Collect safety glasses for all group members
- Collect equipment for the experiment
- Set out a table for the results
- One person records them
- 1 person sets up the experiment
- 2 perform the experiment
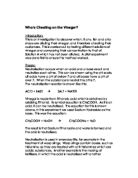
To set up the experiment firstly you have to set up the clamp and connect the burette to it making sure it is safely attached, then measuring the amount of vinegar in to a measuring cylinder to 25ml and poured into the flask, then indicator will be added (a few drops) then place the funnel at the top of the burette and pour the sodium hydroxide to the top making sure the tap is turned off, then place the flask directly under the burette and little by little add the sodium hydroxide so that it turns purple, then turn the tap off and measure accurately where the sodium hydroxide has stopped.
This experiment has to be carried out extremely accurately other wise the results would not be reliable and completely inconsistent. It is also vital that everyone works together to ensure the best possible outcome of results
Observation:
This experiment was quite easy to complete if done correctly, however I did find problems while trying to measure the reading of the sodium hydroxide because they were inconsistent and needed to be tried again, other than that the experiment was a complete success.
Fair Test:
To ensure my experiment was a fair test I had to cover a few things. I made sure the factors which needed to be constant were constant such as the volume of vinegar was measured accurately, the amount of indicator was added drop by drop, the concentration of sodium hydroxide was all ready supplied, I made sure any human errors such as not switching the tap off in time was switched of to the best of my ability and if the tap was not switched off and it overdosed the vinegar the test would be preformed again until it is acurate and so making this experiment a very fair test. I think that these are important factors because it can be detrimental to how accurate and reliable the results were on the whole and it could leave me with anomalous results that have no reason behind their appearance.
Reliable results:
To make certain that my results are reliable, I will take the readings of each volume of sodium hydroxide three times. This means that I will have three sets of data for Vinegar A, Vinegar B, Vinegar C and the Manufacturers vinegar. I will calculate an average for each set of data.
Average =27.9 ml Average=14.2ml
Average=8.1 Average=26.0
The graphs that I shall be drawing up will be of the average results for the recordings. They shall be on separate paper as a part of the investigation.
Analysis of results:
From these tables above I can see that they all show a completely different set of results in each table, which means they all have a different level of concentration in the vinegar. Two of these results tables B and C show an average less than the manufacturers, which suggest the vinegars have been watered down.
Analysis of Graphs:
Both Graphs show an x axis of vinegar A, Vinegar B, Vinegar C and the manufacturers vinegar and on the y axis show the volume of sodium hydroxide (ml) left by the burette.
The bar graph shows vinegar A with the strongest concentration of acid in the vinegar, however vinegar B and C show they have watered down their vinegar dramatically with C being the most watered down.
The line graph shows the same sort of data it shows vinegar A being the strongest concentration of acid in the vinegar and then it slopes down to C which has the lowest concentration of acid.
Conclusion:
From my results, I have come to the conclusion that the more sodium hydroxide added to vinegar the less concentrated the acid is making the vinegar weak. I have also found that two of my results in the table have shown the concentration of acid to be weak this is due to more sodium hydroxide being present in the vinegar solution. The graphs make this clear to understand. I found that doing a preliminary experiment helped me in my real experiment because I knew what to do and what to expect.
Linking my conclusion to prediction:
I predicted the more sodium hydroxide added to vinegar the less concentrated the vinegar would be, I have proved this I my experiment shown in my tables and graphs of results.
Evaluation:
I feel that I preformed this experiment quite well and completed it in the time required during the lesson; I think that this experiment has been a very successful one as my results supported my prediction. I feel my results were particularly accurate as I did measure the volume of sodium hydroxide 3 times in each vinegar, but if I were to do the experiment again I would do it a few more times just for extra accuracy for reliability, the tables and graphs showed straight forward results and there were no strange results (anomalies) I think this was due to accuracy and precision. I believe I could have went in more depth in my method by making it more specific but I did mention all that I did in this experiment.