A series circuit is a circuit in which resistors are arranged in a chain, so the current has only one path to take. The current is the same through each resistor. The total resistance of the circuit is found by simply adding up the resistance values of the individual resistors. A parallel circuit is a circuit in which the resistors are arranged with their heads connected together, and their tails connected together. The current in a parallel circuit breaks up, with some flowing along each parallel branch and re-combining when the branches meet again. The voltage across each resistor in parallel is the same. Adding up the reciprocals of the resistance values, and then taking the reciprocal of the total find the total resistance of a set of resistors in parallel.
Preliminary Results:
From my preliminary results and graph you I have found which values of current that I intend to use. The maximum I will use is 0.44A because above this current the wire may become too hot. Also from my preliminary results were recorded using a 25cm piece of wire that was 30 smg. From this I created a graph, which was a straight line because I plotted voltage against current. I know this is correct because Ohm's law states that for most conductors, the current flowing is proportional to the voltage, provided that the temperature does not change. This means Ohms laws has been obeyed, which means the temperature, is constant. For example, if you double your length of wire, then the resistance will also double. I can conclude that this is the longest piece of wire I should use because if I used a longer piece of wire it may get too hot and then I may produce a curved graph that I know is incorrect.
Method:
I will collect the apparatus and set it up as shown. I will be using a 30-smg piece of wire and use the following lengths of wire: 5cm, 10cm, 15cm, 20cm, and 25cm. I have chosen to use constant intervals between the lengths so that I’m able to find any patterns or anomalies that may occur. I will record five different results for each wire by changing the current using a variable resistor and then repeat the experiment again so that I receive more accurate results and can define any incorrect results. I will also record the resistance, which I will calculate by dividing the voltage by the current. I should find that the resistance for all five results for each length of wire is the same. I will also record the average resistance for each wire length.
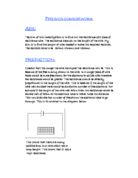
Basic Procedure: I will be using the variable resistor to vary the amount of current through the wire to make sure that the resistance stays the same. I will note the readings from the ammeter and voltmeter that are accurate to two decimal places. (E.g. 0.25) The croc clips are connected to the wire on the heatproof mat with the voltmeter connected in parallel. Once each reading has been noted the variable resistor will be used as described. After that we will replace the wire in between the two crocodile clips with the piece of wire needed.
To make sure that the test is fair I will only change one variable, which will be the length of wire. The temperature may rise inside the wire and so I will use low amounts of current as determined by the preliminary results because if the temperature rises then the atoms in the wire will start to vibrate because they will have more energy and more collisions will occur. This increase in collisions means that there will be an increase in resistance. To keep the wire material and wire width the same I will make certain that I select the same piece of wire each time I record any of my results. The width of the wire will be determined by the measuring it using a micrometer (accurate to 0.01mm). To make sure that the test remains safe I will place a heatproof mat underneath the piece if wire that I use because the wire can get quite hot. Also I must make sure that there is no water on the surface and that I don’t turn the power pack on to high. I will make all my measurements to two decimal places. For the ruler that I will be using I will be able to measure to the nearest millimetre.
Diagram:
Results:
Average of results:
Conclusion: Analysis
From my results I can clearly observe that as the wire length increase the amount of resistivity also increase. This is because as the electrons move through the wire, they bump into atoms. This makes the wire hotter and is what causes the resistance. The longer the piece of wire, the more atoms for the electrons to bump into so there will a resistance increase. This supports my prediction, which was that for the investigation concerning the length of the wire as the wire gets longer, the resistance will increase. This will be in direct proportion and will produce a straight-line graph. Both aspects are supported. A straight-line graph has been produced results showing that the resistance increase on average 0.30 ohms for every 5cm of extra wire used.
My results show as the wire length increase the amount of resistance increase, this is because the longer the piece of wire, the more atoms for the electrons to bump into so there will be a resistance increase. The graph that I will plot should be a straight-line graph; according to Ohm's law. Ohm's law states that for most conductors, the current flowing is proportional to the voltage, provided that the temperature does not change. For example, if you double your length of wire, then the resistance will also double.
My graph also supports this because it shows how the length of wire and the amount of resistance are proportional. This agrees with Ohms law, which states: that for most conductors, the current flowing is proportional to the voltage, provided that the temperature does not change. For example, if you double your length of wire, then the resistance will also double. From the results I can see that there is approximately a 0.30-Ohm rise for every 5cm extra of wire used. This also illustrates the fact that the length of wire and amount of resistivity are directly proportional. The cross-sectional formula shows how I used the same wire each time, the gradient shows the steepness for the line of best fit on my graph and the resistivity of the wire demonstrates how conductive it is.
From my calculations of the resistivity of the wire I have found that my results are reliable as the value compare favourably with the accepted value. The value I calculated was 3.9 x 10 -6
Whereas the actual size is 4.9 x 10⁻⁶ from the data book so there is hardly a significant difference.
Formulas:
Cross sectional area:
Diameter = 0.00028 metres (2.8 x 10 -4 m)
A = π r 2
A = π x 0.00014 2
A = 6.1 x 10 -8 m
Gradient: (worked out from graph)
1.28 / 0.02 = 64
R= PL / A
P = RA / A
A = cross sectional area of wire
L = length
R = resistance
Resistivity of wire:
6.1 x 10 -8 x 64 = 0.04
= 3.9 x 10 -6
Evaluation:
Firstly to make sure that the test was fair I only changed one variable, which was the length of wire. The temperature may rise inside the wire and so I used low amounts of current as determined by the preliminary results because if the temperature rises then the atoms in the wire will start to vibrate because they have more energy and more collisions will occur. This increase in collisions would mean that there would be an increase in resistance. To keep the wire material and wire width the same I made certain that I selected the same piece of wire each time I record any of my results. The width of the wire was determined by the measuring it using a micrometer (accurate to 0.01mm). As I measured the wire in 4 random places this shows and proves that the wire was constant and therefore my results should be accurate. Another factor that proves my results were fair was the fact the calculation for the resistivity of wire was close too the actual figure from the data book, which shows my results, were reliable.
The main factor that would have caused any slight errors was the temperature of the wire. Another way to check that the temperature was constant would have been to put a thermometer next to the wire so the temperature may possibly then be recorded as well. However we used a low current and created an average of our results so any anomalous results that occurred would have discarded. No other improvements can be made because the temperature was the only factor that had to be controlled whereas material of the wire was a choice to be made at the beginning of the experiment. The main reason I chose to use Constantine wire is because of its high resistance. This makes it a lot easier to record the results, as it gives me higher numbers to work with.
Using higher currents so that the temperature does increase could extend the investigation. This could be undertaken to prove that, as the temperature does get higher the graph for the results begins to curve at the end. I included my calculations for the resistivity of the wire as it shows that my results were accurate. I measured the gradient of my straight-line graph as it gives me the best possible average of results omitting any slight anomalous results. This shows that my conclusion about resistance being proportional to the length is very reliable.
If the same experiment were carried out the same factors would apply. If you wanted to change a different variable I would change wire width. For this I predict that as the wire width get small then the more closely packed the electrons are. This would create more collisions so there would be more resistance. If the wire width is increased the resistance will decrease. This is because of the increase in the space for the electrons to travel through. Due to this increased space between the electrons there should be less collisions.
By Luke Howard