Thin Layer Chromatography – Plant Pigments
- Materials
- Developer solvent – iso-octane-acetone.
- 2 strips of chromatography paper.
- Carotene pigment.
- Chlorophyll pigment.
- Apparatus
- 2 Developing Chamber.
- Chamber lid.
- Capillary tube.
- Ruler.
- Procedure
- Gather the required apparatus items and materials.
- Place 25 drops of your developer solvent into each one of the developing chambers and place the lid on.
- Mark each chromatography strip 1cm from each end with a pencil.
- Using the capillary tube, apply three drops of the chlorophyll pigment to one of the strands of the chromatography paper along one of the pencil lines. Allow to dry.
- Repeat step D five times with the chlorophyll, then place the chromatography strip into the developing chamber.
- Allow solvent to travel 1cm away from the top of the piece of chromatography paper then air dry.
- Repeat steps d-f with the carotene dye.
- Mark the distances of the different visible colors on your chromatography strip and the distance the solvent traveled using a pencil.
- Using a ruler, calculate the distances each color traveled and determine your respective Rf values for the different colors.
- Data
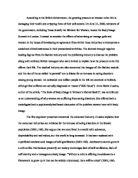
- Our actual Chromatography strips.
- Rf Values
- Chlorophyll
- Carotene
- Statistics
- Our Chlorophyll
- Class Chlorophyll – Lowest Values
- Class Chlorophyll – Second Lowest Values
- Class Chlorophyll – Third Lowest Values
- Class Chlorophyll – Highest Values
- Math
- Rf
Rate of Flow = (Distance of Component)/(Distance of Solvent) = Dx/Ds = Rf
Example: Solvent Traveled 6.8cm. Yellow Pigment Traveled 6.1cm.
Rf=6.1cm/6.8cm=.89 (a unit-less quantity)
- Statistics
- M (mean)
Mean = Summation of all the X numbers Divided by number of X
Example: (.49 + .75 + .78 + .85 + .93 + .94)/6 = .79
- R (Residual)
R = |(x-m)| = Which is the absolute value of the X value minus the Mean value.
Example: .49 - .79 = -.30 = .30
-
R2
Simply the residual squared.
Example: R=.30 R squared = .090
- Ө
Ө = (ε R2/(N-1))1/2 = which is the sum of the residual squared divided by the number of samples minus one square-rooted.
Example: ((.090+.0016+.00010+.0036+.020+.023)/5)1/2 = .166
- S.D.M.
S.D.M. = Standard Deviation of the Mean = (Ө/N1/2) = Sigma/The square-root of the number of samples.
Example: .166/61/2
- Conclusion
In closing, this lab was a perfect introduction into the world of Chemistry. We have acquired the proper data from this lab in a well organized manner. Something to note is the accuracy of our data. Our solvent traveled the same distance on both strips of chromatography paper as well as our values for the yellow pigment which had an Rf of .89 and a distance of 6.1cm traveled from both the chlorophyll and the carotene samples.
The data we received from this lab is as follows. For the chlorophyll, we observed the following five colors: yellow, orange, dark green, green, and light green. For the cartenoid, we observed the following five colors: yellow, auburn, purple, pink, and red. The solvent in both of our experiments traveled a distance of 6.8cm. We obtained the following Rf values for the chlorophyll. For yellow, Rf=0.89; for orange, Rf=0.78; for dark green, Rf=0.51; for green, Rf=0.49; and for light green, Rf=0.44. We obtained the following Rf values for the carotene. For yellow, Rf=0.89; for auburn, Rf=0.81; for purple, Rf=0.69; for pink Rf=0.51; and for red, Rf=0.49.
The second part of this lab dealt with statistical treatment of four of our lowest Rf values of chlorophyll compared to the rest of the class. Our personal S.D.M. value for the chlorophyll was 0.080. The S.D.M. for the lowest level of the class’ Rf value was 0.021. The S.D.M. for the second level of the class’ Rf value was 0.026. The S.D.M. for the third level of the class’ Rf value was 0.058. The S.D.M. for the highest level of the class’ Rf value was 0.068. The mean value from lowest to highest of the class’ Rf values are as follows: .45, .48, .57, and .79.
Something to note about the data is the comparison of the S.D.M. values. Our personal S.D.M. values was slightly higher then the S.D.M. values calculated for each section of the class. However, our S.D.M. is calculated with all of the values we received instead of just one batch of data. Also, it appears as though as the numbers grow larger, the deviance of the class grows along with it which means that as numbers are greater the class becomes less accurate.