The distribution of maggots over dark and light areas was recorded over a period of three minutes.
- The procedure was repeated (using other maggots) 10 times.
- The data was recorded as following.
Results:
Table 1: The distribution of maggots over fly larvae
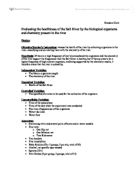
Fig.1: Depicting the proportion of maggots which exhibited a negative phototaxis (74%) and the proportion which exhibited a positive phototaxis (26%).
Null hypothesis: 50% of the fly larvae stay on the light half of the tray and 50% on the dark half.
In order to confirm or reject the null hypothesis, chi-squared test was carried out.
Number of groups: 2
Observed frequency (O) in group one: 1+2+2+2+5+3+1+4+4+2 = 26
Observed frequency (O) in group two: 9+8+8+8+5+7+9+6+6+8 = 74
Expected frequency (E) in group one: (26+74) /2 = 50
Expected frequency (E) in group two: (74+26) /2 = 50
Table 2: Depicting the calculated parameters for chi-squared test
X2 = ∑ (O – E) 2/E
X2 = 11.52 + 11.52 = 23.04
Degrees of freedom: n-1 (number of groups minus one); 2 – 1 = 1
The critical values of chi-square distribution with 1 degree of freedom from the reference table for chi-square test are:
At 5%: 3.84
Conclusion and evaluation: Since the chi-square value i.e. X2 = 23.04 is higher than the critical values at 5%, therefore, the null hypothesis can be rejected; implying that with 95% certainty the distribution of fly larvae is not even in the two regions. As comes from figure 1, approximately 3/4 of the maggots show a negative phototaxis i.e. tend to move to the darker region, while 1/4 of the maggots tend to exhibit a positive phototaxis i.e. tend to stay in the light. It could, thereby, be concluded that the result obtained holds true for the hypothesis made.